
Poet’s Network Visualisation
In this project we have used Gephi to visualise the network between poets and other related objects, including people, places, works and institutions, etc. Gephi (http://gephi.org) is a free open-source software for visualising network relationships. Users can help expanding and developing new functions and extensions to make the software more powerful.
For visualising networks using Gephi, two spreadsheets have to be prepared: nodes (objects) and edges (relationships). We have used different colours to distinguish the nature of objects and their relationships. 5 large groups have been identified:
- Author: the 514 poets collected in The Bibliography
- Related people: including family members, friends, colleagues, teachers, students, the people who helped written those preface, introduction, etc. that appear in the entry
- Works: the works that are listed and mentioned in the entry
- Institutions: related ones, e.g. education, work, etc.
- Places: including the origin (if it is mentioned), place of birth, worked, stayed, all those mentioned in the entry
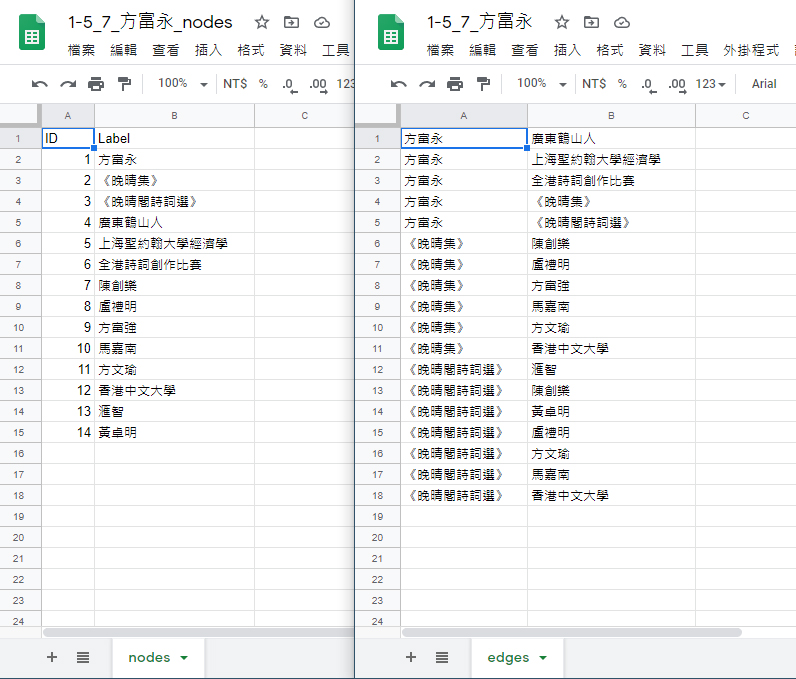
We take “方富永” as an example below:
The following objects (item/name) have been appeared in the Poet’s entry. We listed out and assign an ID (code) for them in the left and the relationships one by one in the right. The same process repeats for the other 513 poets, but the IDs are assigned after completing the object retrieval to avoid duplication. Afterwards, it needs to note that all these objects have to be converted to ID for Gephi to process. Instructions can be found from Gephi or related tutorials.
Below is the network graph for 32 poets whose surname is in 1-5 strokes:
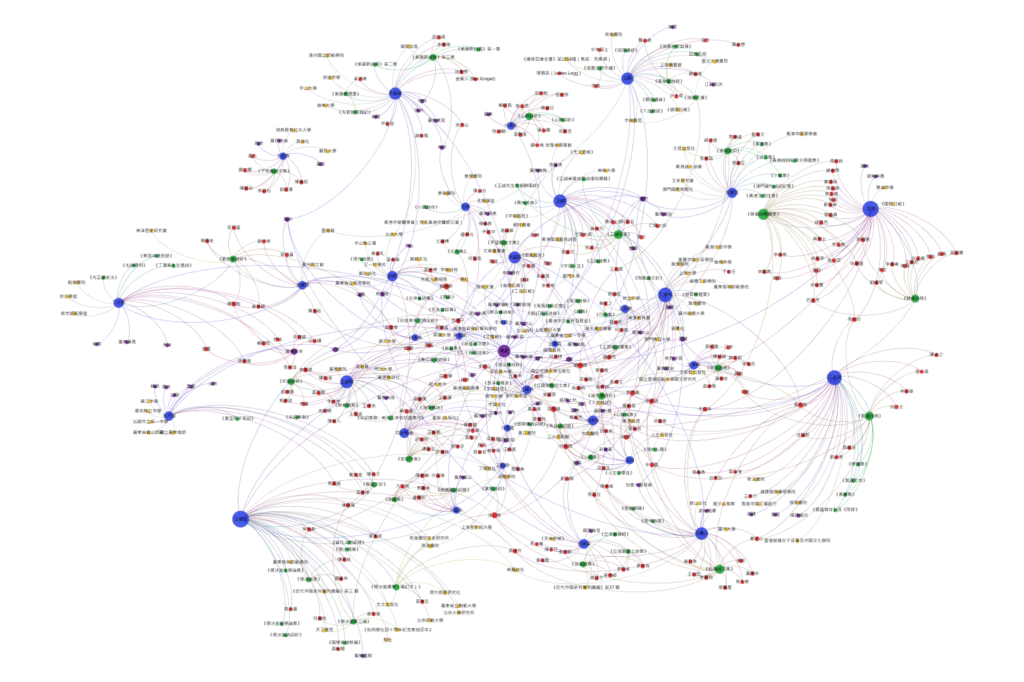
The network graph shows the 32 poets who are born, stayed and/or lived in Hong Kong with surname in 1 – 5 strokes in The Bibliography. The purple dot at the centre is Hong Kong, while for other objects they are represented by different colours:
- Author: blue
- Related people: red
- Works: green
- Institutions: orange yellow
- Places: purple
Data
The Excel spreadsheet of data will be available later for reference or use upon author’s agreement. Of course, with the data, users can have further analysis or visualisation on the poet’s network, and add more relationships and details for the poet(s) who is/are being studied.
Network Visualisation
“Visualising” the network between people and their related people, institutions makes relationships more easily to be understood. Sometimes hidden messages between relationships can be revealed with the network graphs drawn.
Software Available in University Library
There are 10 workstations in Digital Scholarship Lab on G/F of University Library having Gephi installed (available in both PC and iMac), while there are other similar software for network visualisation such as Cytoscape for biological network, or even Python. You may take a look on the tools page for available software and welcome to use in facilitating your research.