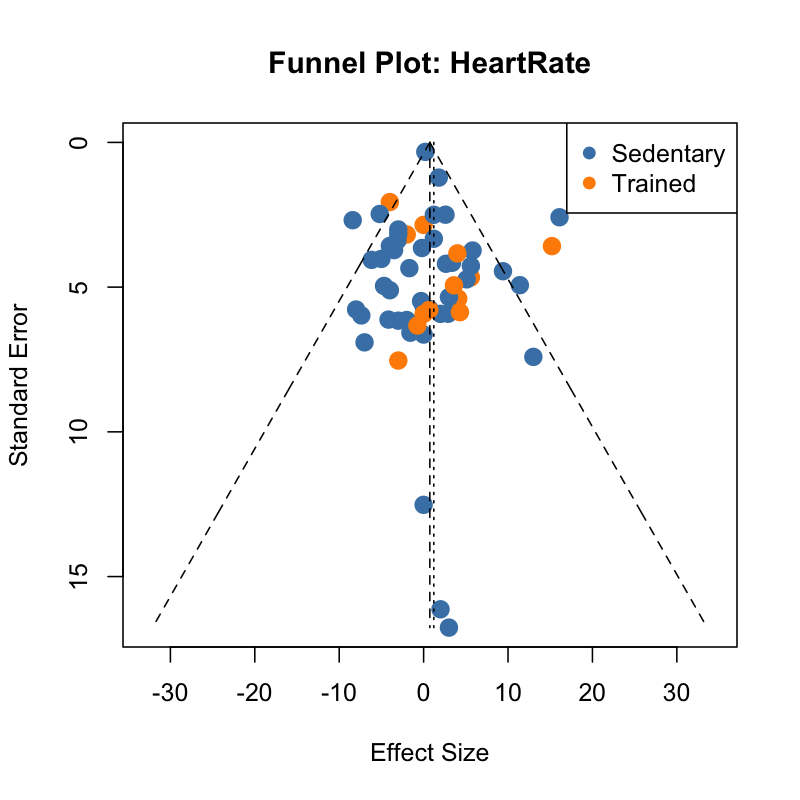
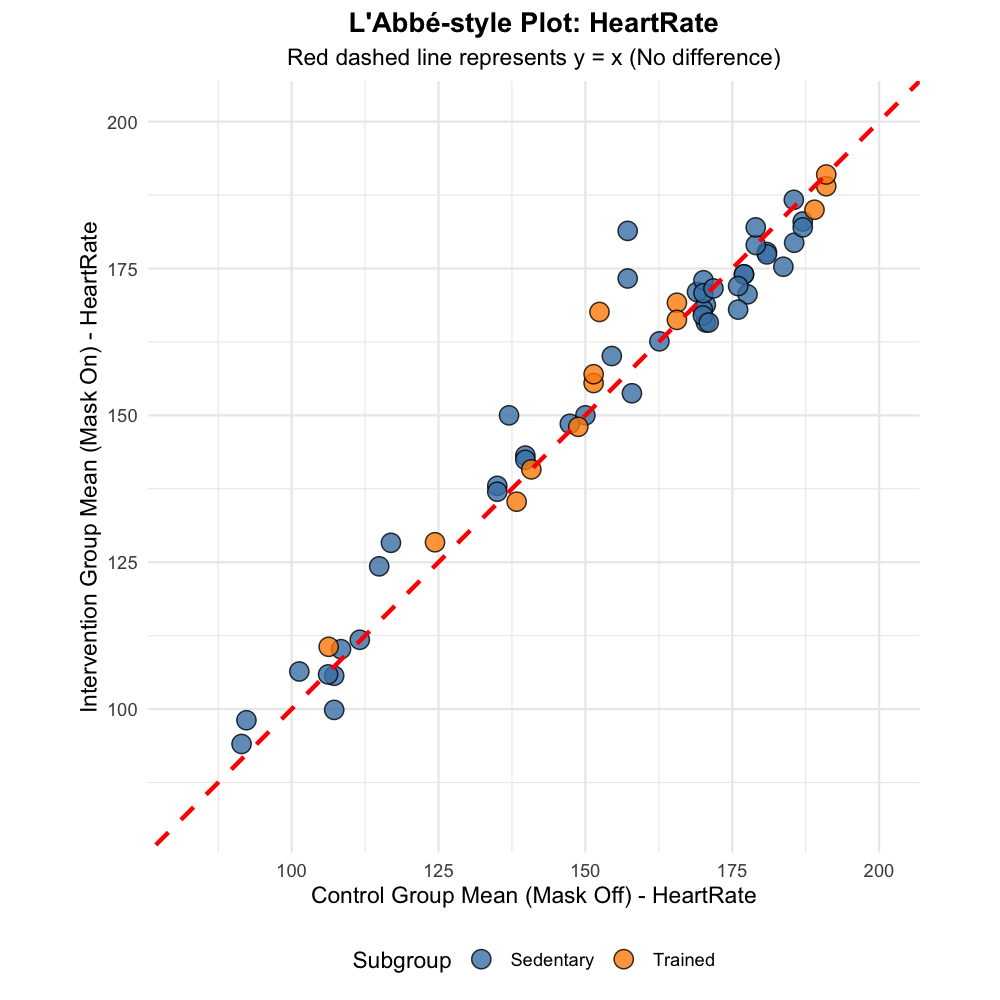
(Click to expand) Across all included studies, wearing a mask tends to raise heart rate slightly compared with no mask, but the pooled effect is small and not statistically or clinically meaningful for most populations. Converting the largest standardised effect into a more intuitive metric suggests roughly a 3–5 beats per minute increase at most.
Subgroup analyses show similar small effects across mask types and fitness levels. Respirators in healthy adults show a modest trend towards higher heart rate, while cloth masks can show the opposite, and trained participants display relatively consistent responses with lower heterogeneity. Overall, the evidence does not support the idea that masks substantially stress the heart during typical exercise protocols.Table 1. Standardized Mean Difference of each subgroupFigure 1. Funnel plot of Heart RateFigure 2. L’Abbé plot of Heart Rate
Performance
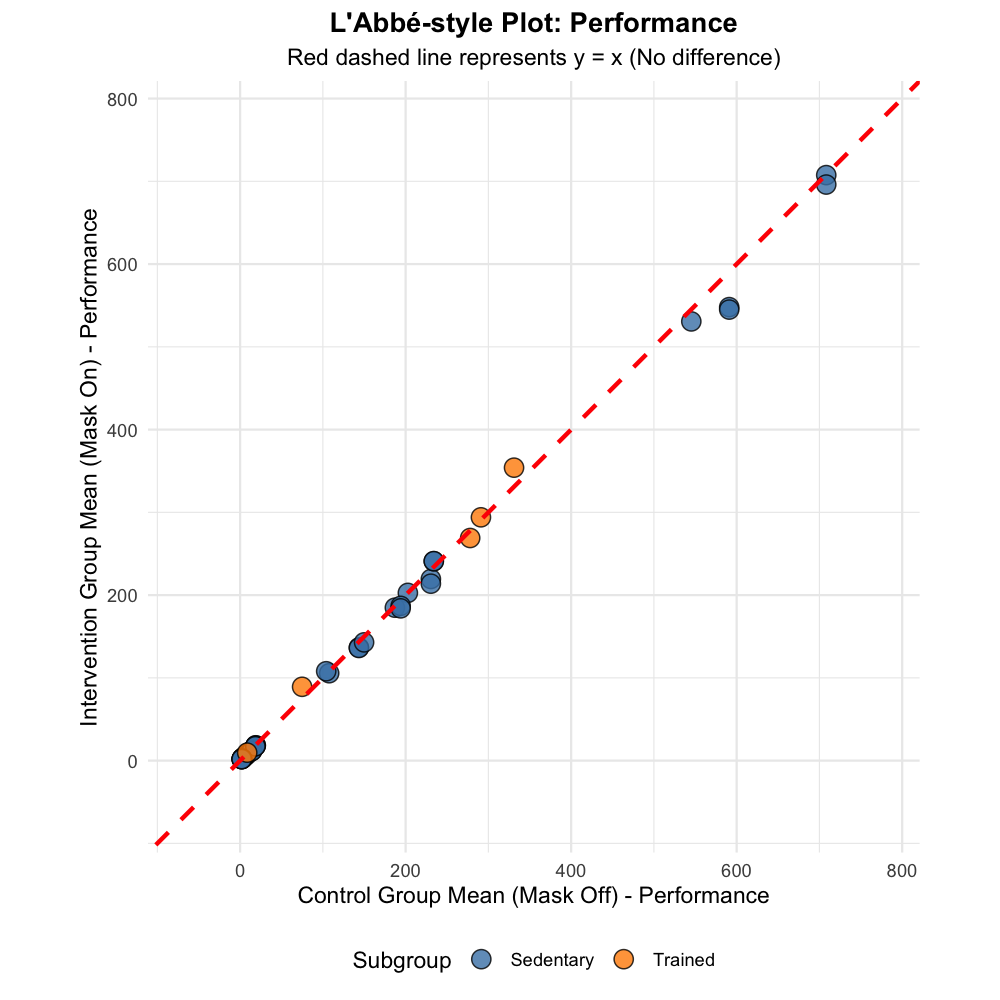
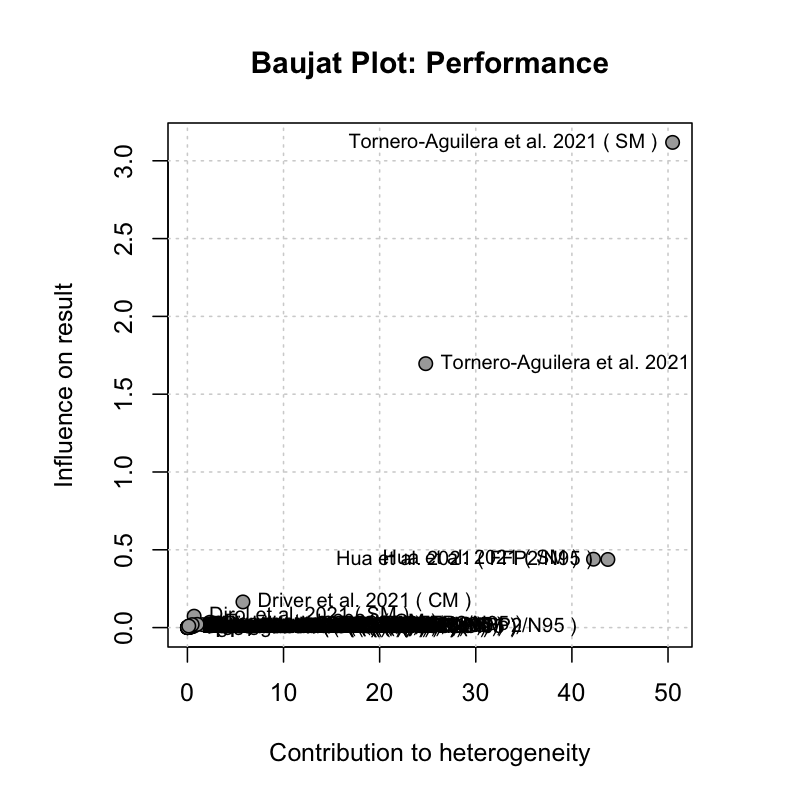
In contrast to heart rate, exercise performance shows a clear and statistically significant reduction when participants wear masks. On the forest plot, the pooled effect lies to the side of reduced performance for both healthy and trained subgroups, indicating that, on average, people do slightly less work with a mask than without.
L’Abbé plots show most data points below the line of equality, meaning masked trials usually achieve lower absolute outputs, such as shorter time to exhaustion or less distance covered. However, there is substantial heterogeneity, driven by differences in performance metrics and whether protocols are maximal or submaximal, and funnel plots suggest some publication bias towards studies that report performance impairment. Even accounting for these issues, the overall pattern points to a modest but consistent performance cost of exercising with a mask, especially when maximal performance matters.Figure 3. Funnel plot of PerformanceFigure 4. L’Abbé plot of PerformanceFigure 5. Baujat plot of Performance
Rate of Perceived Exertion (RPE)
For RPE, the pattern is much stronger and more consistent. The pooled effect lies clearly on the side of higher perceived exertion with masks, and this holds for both healthy and trained subgroups. Across trials, participants report that the same exercise bout feels harder when they are masked, even when objective physiological changes are relatively modest.
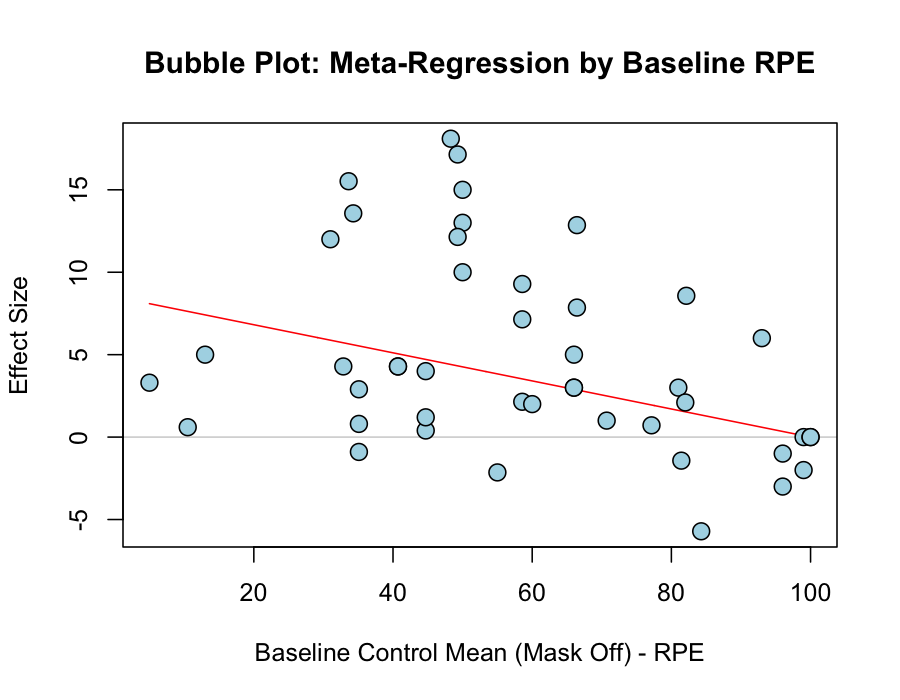
L’Abbé plots show the vast majority of points above the equality line, confirming higher subjective effort in the mask condition. Meta‑regression using bubble plots indicates that the mask’s added impact on RPE is most pronounced at lower exercise intensities, while the difference narrows at very high intensities because of ceiling effects in perceived exertion scales. In short, exercising with a mask reliably feels harder, particularly for lower to moderate workloads.Figure 6. L’Abbé plot of RPEFigure 7. Bubble Plot of RPE
Blood oxygen saturation (SpO2)
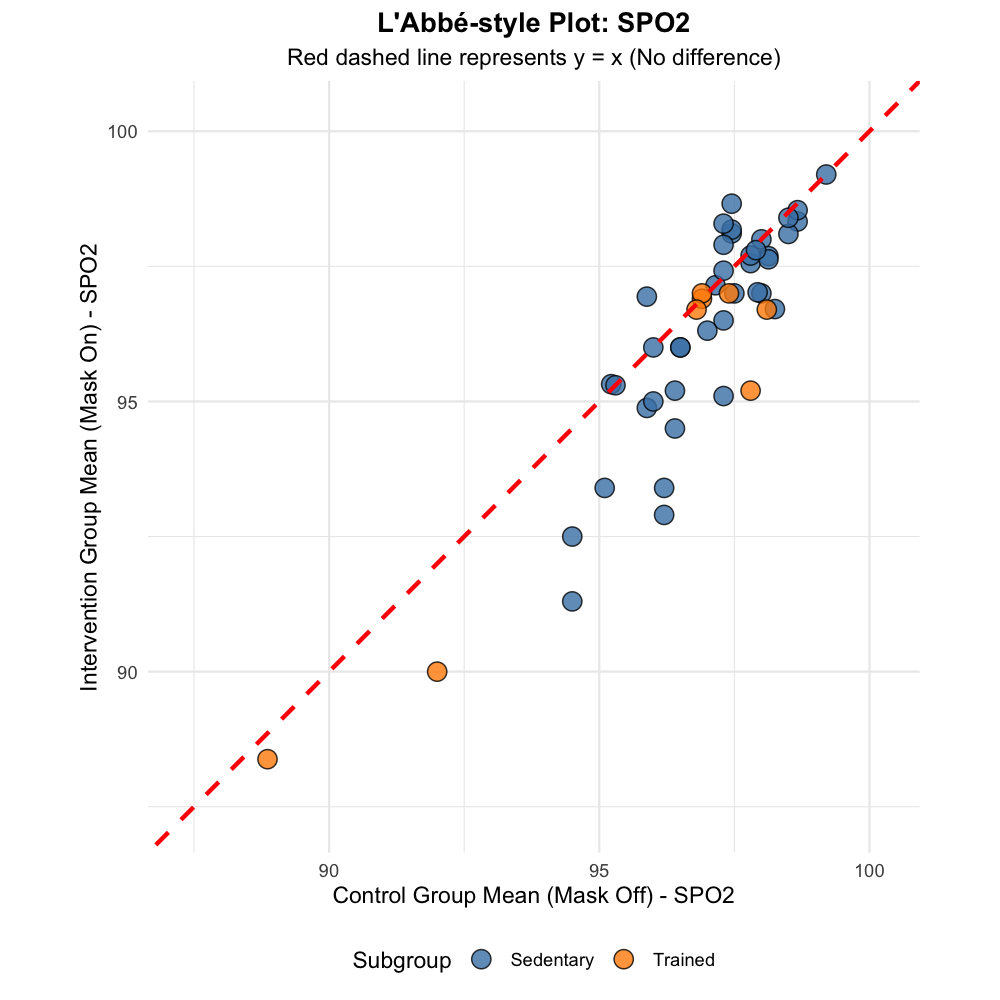
Blood oxygen saturation is a key safety concern. When we pool SpO₂ data, masks cause a small but statistically detectable reduction in oxygen saturation compared with no mask. Most individuals, however, remain within normal physiological ranges, and the absolute drop is generally limited in both healthy and trained adults.
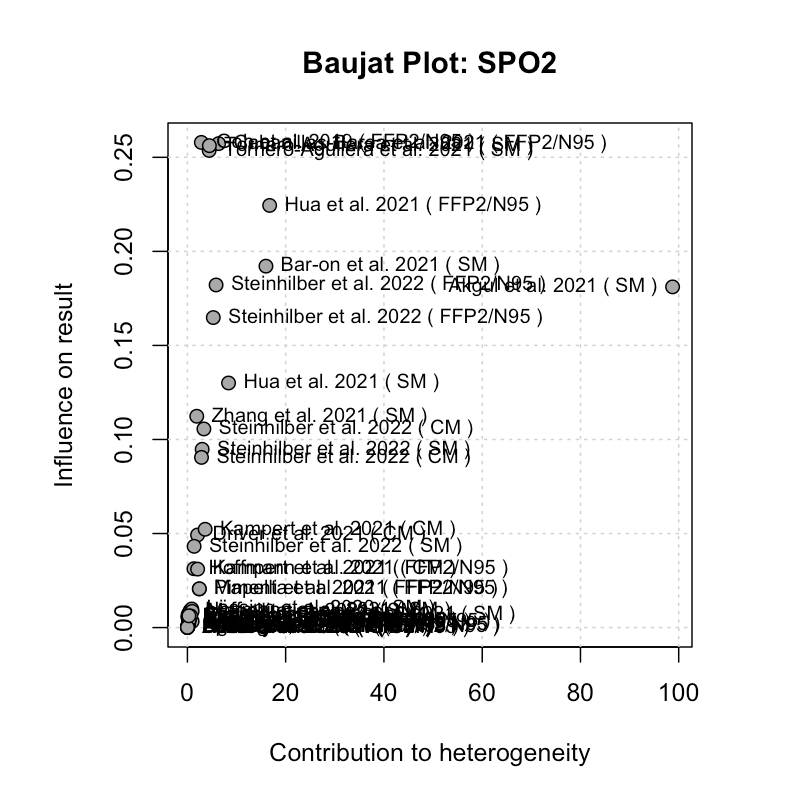
Plots comparing mask‑on and mask‑off values show that most points fall below the equality line, with the healthy subgroup displaying a wider spread of desaturation than the more tightly clustered trained group. Baujat and radial plots identify influential studies using maximal or near‑maximal protocols and more restrictive respirators, which show slightly larger drops, while moderate protocols or more breathable masks produce minimal changes. Overall, masks can slightly reduce SpO₂ during exercise, but within the datasets we analysed this effect is small and typically remains within safe limits.Figure 8. L’Abbé plot of SpO2Figure 9. Baujat plot of SpO2
Lactate
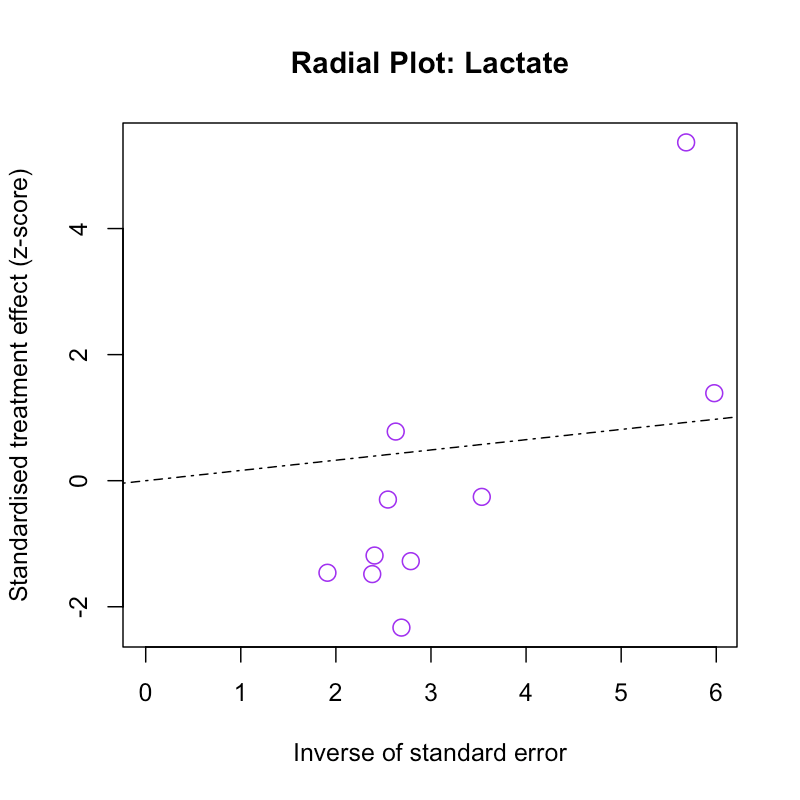
When all lactate data are pooled, the overall effect sits very close to the line of no difference, indicating that masks do not systematically produce a large additional metabolic burden across studies. Exercise intensity and protocol appear to be the primary drivers of lactate levels, with the mask playing a secondary role.
In some healthy groups, lactate is slightly lower with masks, likely because participants cannot reach their absolute peak workload and terminate exercise earlier, while in trained participants results are mixed, with small increases and decreases across studies. Visual diagnostics, including L’Abbé, Baujat and radial plots, highlight substantial heterogeneity and a few influential outliers with specific protocols or measurement methods. Taken together, the evidence suggests that masks do not consistently raise or lower lactate in a large, uniform way.Figure 10. L’Abbé plot of Lactate Figure 11. Radial Plot of Lactate