
Author Frequency Presented in a Bar Chart Race
In order to explore the change in the trend of author frequency in The Weekly, we created a bar chart race. Traditional bar chart displays data in a static manner that readers can read the data in detail. On the other hand, bar chart race displays data in a series of bar charts running continuously.
The bar chart race in Fig. 1 presents the top twenty frequent authors in each year in The Weekly during its publications from 1952 to 1974 (except 1967). The visualisation depicts the productivity of authors and the change in the trend across the twenty-two years of publications. During those years, authors used different pennames to publish. The bar chart race also demonstrates the use of various pennames by authors at different periods.
Author Frequency in The Chinese Student Weekly (Top 20)
According to Fig. 1, some of the frequent authors in the early 1950s were Kunnan (崑南), Huang Sicheng (黃思騁), and Mai Jing (麥菁). Xiao Qing (小慶), Dan Ni (但尼), Lan Zi (藍子), and Zhang Ailun (張愛倫) came up in the late 1950s. Xiao Qing, best known as Lu Li (陸離), was also productive in the following decades until The Weekly stopped publishing in 1974. Before moving to writing with her best known name from the mid-1960s, Lu Li used the penname Xiao Li (小離) in the early 1960s. Both Lan Zi and Zhang Ailun are the pennames of Xi Xi (西西). She adopted the penname Nam Nam (南南) in the late 1960s. From the mid-1960s onwards, the active author Xiao Si (小思), which is her best known penname, used also the panname Ming Chuan (明川) in her publications. In the last publication year of The Weekly, Yesi (也斯) published also with his original name Leung Ping-Kwan (梁秉鈞). Both names are on the top of the bar chart race.
Other than learning the pennames of authors, the bar chart race also reveals some significant genres published in The Weekly. Film criticism was one of them. Dan Ni and Lu Li, with their names being on top of the race in both the 1950s and the 1960s, were important film critics. Other film critics appearing on the race are Law Kar (羅卡), Shi Qi (石琪) and Wu Hao (吳昊). Other than text in Chinese, The Weekly included writings in English. The Peanuts comics was published since early 1960s. Its author Charles M. Schulz stays on the top of the race between 1961 and 1964.
Creating a Bar Chart Race
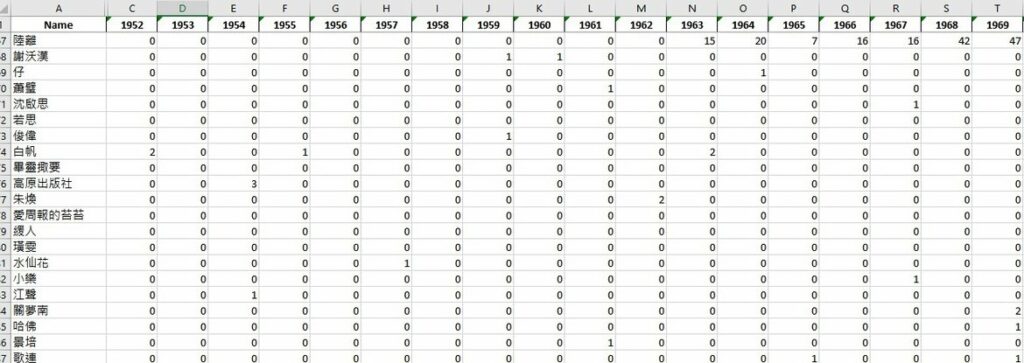
To create a bar chart race, the statistical data have to be in the form of Fig. 2, with the frequency of each data value in each year being stated. Putting the statistics into a tool for creating bar chart race generates a bar chart race like Fig. 1.
For displaying the author frequency of The Weekly, we needed the author frequency statistics from the metadata of The Weekly records in the Hong Kong Literature Database. 53,374 out of 79,975 records of The Weekly contain data on creator. Some data contain words which are not useful for author frequency analysis and are thus called “stopped words.” Examples of stopped word include illustrated, translated, or interviewed. We removed the stopped words in the Creator field before cleaning the data with OpenRefine.
While some Creator fields consist of more than one author per record, we extracted all the author names with the function def create_full_name_list. We put the 55,506 extracted names, 18,804 of them being unique, for data cleaning again. With the various patterns in author names and stopped words, the name extraction and data cleaning techniques are still experimental. The extracted names are yet under strict authority control. We will continue to further refine the methods.
We then generated the statistics of author frequency in each year with the functions def search_year and def generate_data_for_year. Although some authors used a number of pseudonyms for their publications in The Weekly, the statistics took each unique name, rather than unique person, for accounting the author frequency. Since some advertisements were published recurrently in each issue, the names of the stakeholders appeared frequently. However, these names were not in our analytical concerns. We, therefore, took away these names from the list before ingesting the statistics into the tools for creating bar chart races. Fig. 1 was created with flourish.studio.
We are also using the plotly library in Python to build traditional bar charts of author frequency in The Weekly. Users can see bar charts of not only the statistics of each pseudonym, but also the total publication number of each author under all his/her pseudonyms. Furthermore, users can also view any range of author frequency ranking in any specific year. This tool will be released in the future on another platform in the CUHK Library website.
Code
The following code in Python 3.7 is for the preparation of the author frequency statistic.
# -*- coding: utf-8 -*-
import pandas as pd
# Get a list with all names
def create_full_name_list():
author_data = pd.read_csv('weekly_metadata.csv')
full_name_list = list(author_data['column_name_author_name_after_removing_stopword'])
full_name_list = list(set(full_name_list))
return full_name_list
# Get the first and last year in the dataset
def search_year():
data = pd.read_csv('weekly_metadata.csv')
date_list = list(set((list(data['column_name_search_date']))))
date_list = [str(x) for x in date_list if str(x) != 'nan']
yearList = []
# Get the year from the date
for i in range(0,len(date_list)):
yearList.append(date_list[i][(date_list[i].rfind('/')) + 1 :])
yearList = list(set(yearList))
yearList.sort(reverse = False)
first_year = yearList[0]
last_year = yearList[-1]
return first_year, last_year, yearList
# Count the frequency of each name in a year
def generate_data_for_year(year, name_list):
data = pd.read_csv('weekly_metadata.csv')
year_str = str(year)
temp_data = data[data['column_name_search_date'].str.contains(year_str, na = False)]
name_list_from_temp_df = list(temp_data['column_name_author_name_after_removing_stopword'])
temp_dict = {}
temp_count = []
# Count the frequency of each element
for i in range(0, len(name_list)):
count = 0
for element in name_list_from_temp_df:
if str(element) == name_list[i] and str(element) !='nan':
count = count + 1
temp_count.append(count)
return temp_count# create full name list
data = {}
full_name_list = create_full_name_list()
cat_list = []
# Assign the name to different categories for differnet color
for i in range(0, len(full_name_list)):
cat_list.append(i % 50)
data['Name'] = full_name_list
data['cat'] = cat_list# generate the data for each year
first_year, last_year, yearList = search_year()
# Get the count for each name in each year
for year in yearList:
current_year_count = generate_data_for_year(year, full_name_list)
data[year] = current_year_count# generate csv and xlsx files
df = pd.DataFrame.from_dict(data)
df.to_csv('data_for_bar_chart_race.csv', encoding = 'utf-8', index = False)
df.to_excel('data_for_bar_chart_race.xlsx', encoding = 'utf-8', index = False)