Formula Origin Finder
Overview
To facilitate the study in formulae customisation, we have developed a formula origin finder. There are 2 types of origin finders, One-Hot and Quantity. As the names imply, they use different models. However, they have a similar interface.
The origin finder would calculate the pairwise distance between the custom formula and each formula in the model. We choose the top k-th neighbours as the possible origins for the custom formula.
For the One-Hot Formula Origin Finder, cosine distance is used since cosine will only consider the direction of the features rather than their magnitudes. It is suitable for one hot encoded matrix.
For the Quantity Formula Origin finder, Euclidean distance is used on the normalized dataset. This configuration gives the most reasonable neighbours in trial and error.
Case Study for One-Hot Formula Origin Finder
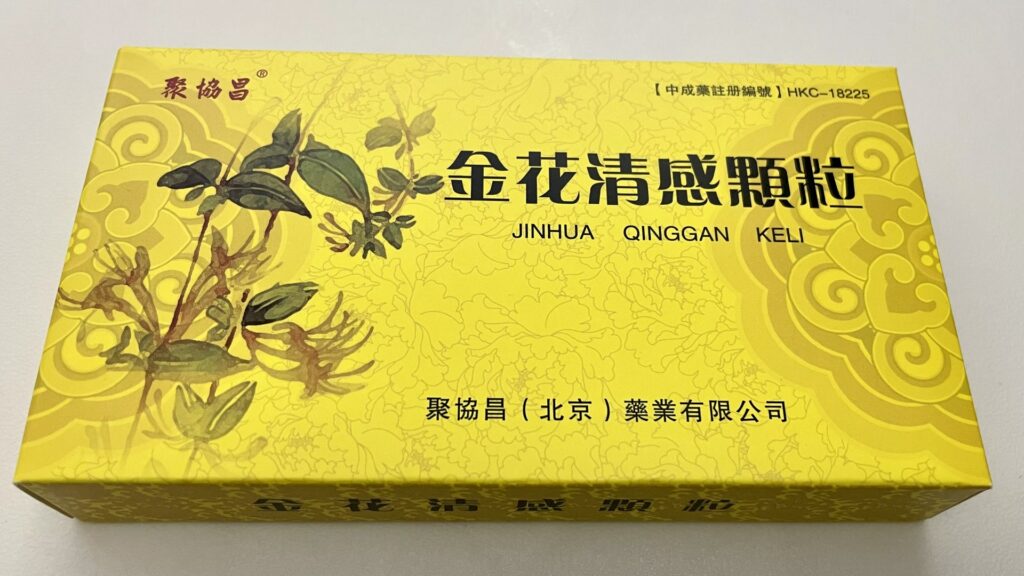
Until today, formulae from Shang-Han-Lun can still show its significance. For example, Jinhua Qinggan Granule (金花清感顆粒) is a well-known proprietary Chinese medicine in COVID-19. It contains the composition of Ma-Huang-Tang-Fang (麻黃湯方). Using the Formula Origin Finder, we can input the ingredients in this medicine using a one-hot encoded method, which means that the user only needs to select the herb used in the custom formula.
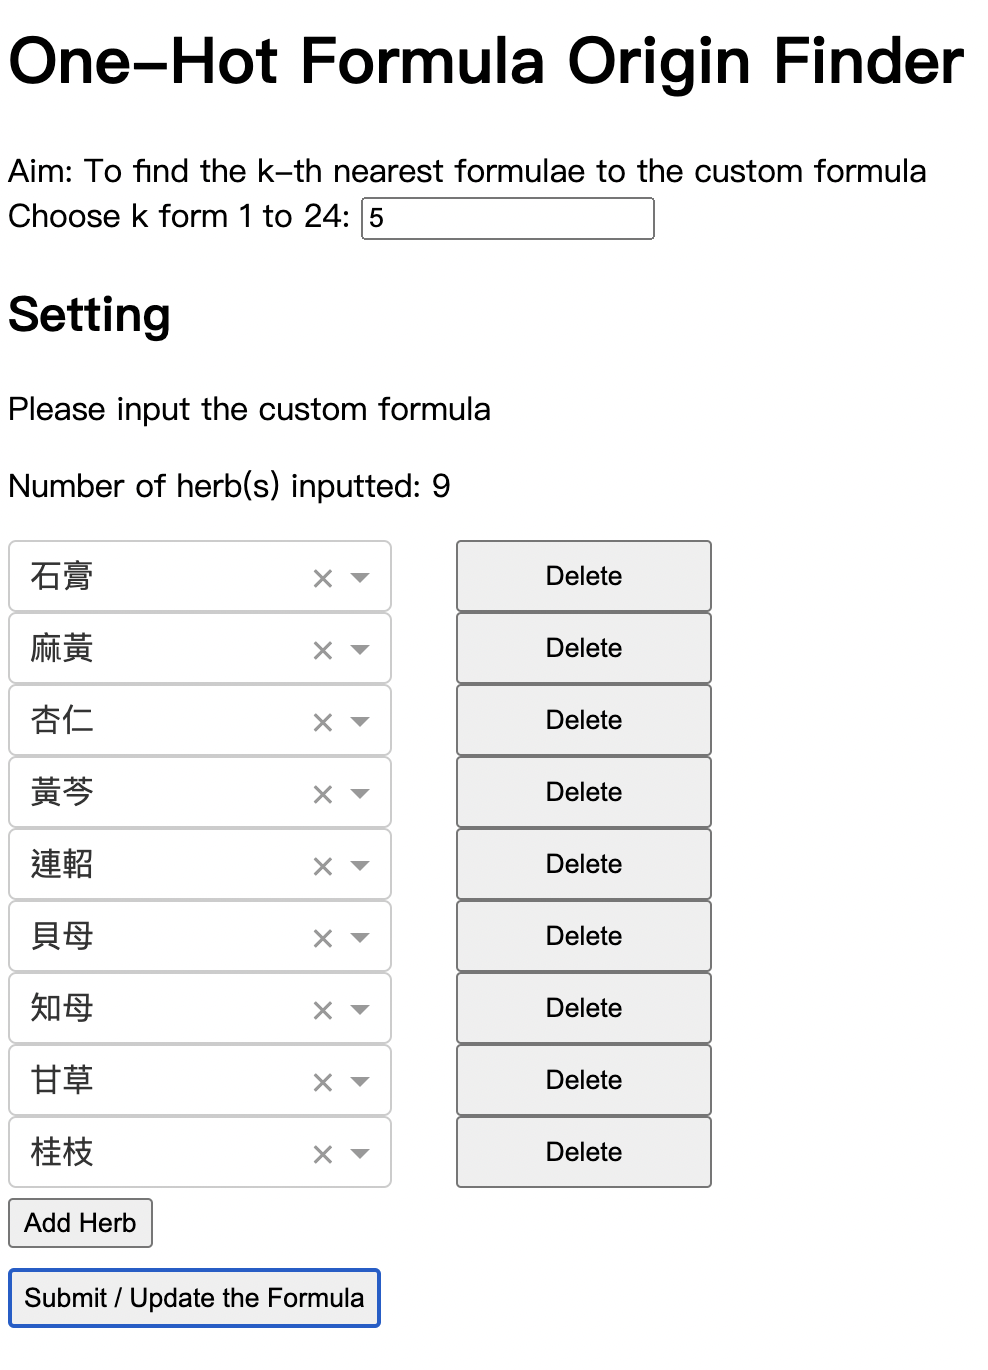
Here is the interface of the one-hot origin finder. We have provided tables, heatmap and stacked bar chart to compare the formulae.
Full Interface


The table (Figure 3) is sorted descendingly according to their similarity with the custom formula. In other words, when a formula is higher in the table, it is more similar to the custom formula. Ma-Huang-Gan-Cao-Xing-Ren-Shi-Gao-Tang-Fang (麻黃甘草杏仁石膏湯方), in the blue box, is the closest formula to the custom formula (in the red box), according to the herb species used.
Moreover, 麻黃甘草杏仁石膏湯方 is close to 麻黃湯方 (in the orange box) because 麻黃甘草杏仁石膏湯方 is modified from 麻黃湯. They treat similar diseases.

Two more visualizations are provided to compare the results of the One-hot Origin Finder. The first one is the heatmap (Figure 4) showing the similarity across the formulae, the darker the colour, the more similar the two formulae are.

The second one (Figure 5) compares the composition of formulae by herb categories.

Code for the one-hot formula origin finder
Here is the code for imports and data loading.
import pandas as pd
import plotly.express as px
from sklearn.metrics import pairwise
from sklearn.neighbors import NearestNeighbors
from dash import Dash, dcc, html, Input, Output, callback, dash_table, State, Patch, no_update, ALL, ctx
from io import StringIO
import json
from utils import get_formulae_composition_by_type, getLocation, removeTextColumn

pd.DataFrame.iteritems = pd.DataFrame.items  # since iteritems is removed from pandas 2.0

one_hot_model = pd.read_excel("../one_hot_model.xlsx", header=0)
one_hot_model_herbs = list(one_hot_model.columns[1:])
chinese_quantity_model = pd.read_excel("../chinese_quantity_model.xlsx", header=0)
herb_types = pd.read_excel("../herbs_name_animalplantseparation.xlsx", header=0, index_col=0, usecols=[1, 3])
formulae_locations = getLocation()
one_hot_model = pd.merge(one_hot_model, formulae_locations, how='left', on='Name')

# relocate the location columns
locations = one_hot_model.pop('Location')
one_hot_model.insert(1, locations.name, locations)

one_hot_test_cases = [
    ['石膏', '麻黃', '杏仁', '黃芩', '連軺', '貝母', '知母', '甘草', '桂枝'],
    ['桂枝', '甘草', '麻黃', '杏仁', '生薑'],
    ['桂枝', '麻黃', '杏仁', '五味子']
]
Here are the utility functions.
import pandas as pd
import plotly.graph_objects as go

herb_types = pd.read_excel("../herbs_name_animalplantseparation.xlsx", header=0, index_col=0, usecols=[1, 3])


def removeTextColumn(df):
    textCols = ['Name', 'Location']
    for textCol in textCols:
        if textCol in df.columns:
            df = df.drop(textCol, axis=1)
    return df


def get_formulae_composition_by_type(data, title, one_hot=False):
    formulae_table = pd.DataFrame(data)
    dosage_table = removeTextColumn(formulae_table)
    totals = dosage_table.sum(axis=1)
    herb_list = list(dosage_table.columns)

    categories = dict(herb_types.groupby('藥物種類').value_counts(ascending=False))
    categories = {k: v for k, v in sorted(categories.items(), key=lambda item: item[1], reverse=True)}
    categoriesContent = [category + "content" for category in categories]
    for category, categoryContent in zip(categories.keys(), categoriesContent):
        formulae_table[category] = 0.0 if not one_hot else 0
        formulae_table[categoryContent] = ""

    for index, row in formulae_table.iterrows():
        for herb in herb_list:
            if row[herb] <= 0:
                continue

            changes = float(row[herb]) if not one_hot else row[herb]
            formulae_table.at[index, herb_types.at[herb, '藥物種類']] += changes
            formulae_table.at[index, herb_types.at[herb, '藥物種類'] + "content"] += herb + " "

    for category in categories:
        countsOrDosages = formulae_table.loc[:, category]
        percentages = [round(countOrDosage / total * 100, 2) for countOrDosage, total in zip(countsOrDosages, totals)]
        formulae_table[category] = percentages

    fig = go.Figure(layout={
        "xaxis": {"title": "Formulae name"},
        "yaxis": {"title": "Percentage"},
        "title": title
    })
    named_table = formulae_table.set_index('Name')
    for category in categories:
        template = []
        for name in named_table.index:
            title = f"<b>{name}</b>"
            info = f"<br>Category={category}<br>Percentage={named_table.loc[name, category]}%<br>"
            categoryContent = f"{category}={named_table.loc[name, category + 'content']}<extra></extra>"
            template.append(title + info + categoryContent)

        fig.add_trace(
            go.Bar(
                x=formulae_table.loc[:, "Name"],
                y=formulae_table[category],
                name=category,
                hovertemplate=template,
            )
        )

    fig.update_layout(barmode='stack')
    return fig


def getLocation():
    merge_result = pd.read_excel("../shanghanlun_mergeOCR_afterExpansion.xlsx", header=0, index_col=0)
    volumeName = {4971387: '仲景全書卷一', 4971388: "仲景全書卷二", 4971389: "仲景全書卷三"}
    df = dict()
    df['Name'] = merge_result.index.copy()
    df['Location'] = [f"{volumeName[volumeId]} 第{startPage}頁"
                      for (volumeId, startPage) in merge_result[['VolumeID', 'StartPage']].values.tolist()]
    df = pd.DataFrame.from_dict(df)
    return df
Here is the code for drawing figures.
def get_heatmap(df, labels, precomputed=False):
    if not precomputed:
        dist = pairwise.cosine_distances(df)
        df = pd.DataFrame(dist, index=labels, columns=labels)

    title = "Differences across formulae"
    description = "<br><sup>The Darker, The More Similar</sup>"
    fig = px.imshow(
        df,
        labels=dict(x="Formula 1", y="Formula 2", color="Distances"),
        x=labels,
        y=labels,
        title=title+description
    )
    if len(df.index) > 24:
        fig.update_layout(height=800)
    else:
        fig.update_layout(autosize=True)
    return fig


one_hot_default_heatmap = get_heatmap(
    removeTextColumn(one_hot_model),
    labels=one_hot_model.loc[:, 'Name'],
)
one_hot_default_formulae_composition_by_type = get_formulae_composition_by_type(
    one_hot_model.loc[:3, :],
    title="Sample formulae composition by herb categories",
    one_hot=True
)
Here is the code for the layout.
one_hot_comparator = Dash(__name__)

one_hot_comparator.layout = html.Div([
    html.H1("One-Hot Formula Origin Finder"),
    html.Div("Aim: To find the k-th nearest formulae to the custom formula"),
    html.Label("Choose k form 1 to 24: ", htmlFor='one-hot-k'),
    dcc.Input(
        id='one-hot-k',
        value=5,
        min='1',
        max='24',
        type='number',
    ),

    html.H2("Mode", id="one-hot-setting-mode", style={"display": "none"}),
    dcc.RadioItems(
        id='one-hot-mode',
        options=[
            {"label": "production", "value": "production"},
            {"label": f"test case 1 {one_hot_test_cases[0]}", "value": "0"},
            {"label": f"test case 2 {one_hot_test_cases[1]}", "value": "1"},
        ],
        value='production',
        style={"display": "none"}
    ),

    html.H2("Setting"),
    html.Div("Please input the custom formula"),
    html.Label("Number of herb(s) inputted: ", htmlFor='one-hot-herb-count'),
    html.P("0", id='one-hot-herb-count', style={"display": 'inline-block'}),
    html.Div(
        id='one-hot-dynamic-fields-container',
        children=[
            html.Button(
                'Add Herb',
                id='add-field-button',
                n_clicks=0,
                style={'marginTop': "5px", "height": "25px", "display": "block"}
            ),
            html.Button(
                'Submit / Update the Formula',
                id='one_hot_submit_button',
                n_clicks=0,
                style={'marginTop': "10px", "height": "30px", "display": "block"}
            ),
        ]
    ),

    html.H2("Result"),
    html.H3("Chinese Quantity"),
    html.Div("Note that the custom formula is excluded in this table", id='one-hot-table-scope-hint'),
    dash_table.DataTable(
        data=[],
        id='one_hot_comparator_textTable',
        style_table={
            'width': 'fit-content',
        },
        style_cell={
            'paddingLeft': '1rem',
        },
    ),

    html.H3("One-hot encoded table"),
    dash_table.DataTable(
        data=[],
        id='one_hot_table',
        style_table={
            'width': 'fit-content',
        },
        style_cell={
            'paddingLeft': '1rem',
        },
    ),

    html.H3("Heatmap"),
    html.Div(
        "Note that when there are too many formulae to show, the formula name may be hidden at the axis. You can zoom "
        "in for more details."
    ),
    dcc.Graph(
        figure=one_hot_default_heatmap,
        id='one_hot_compartor_heatmap'
    ),

    html.H3("Composition of formulae"),
    dcc.Graph(
        figure=one_hot_default_formulae_composition_by_type,
        id='one_hot_composition_by_type'
    ),

    # standardized(model + custom_formula), col[0] = Name
    dcc.Store(id='one_hot_pairwise_distances_store'),
    # k-th neighbors of the custom formula: dict of {index: Name}, len = k + 1, include the custom formula
    dcc.Store(id='one_hot_selected_formulae_indices')
])

one_hot_comparator.title = 'One-hot Encoded Formula Origin Finder'


if __name__ == '__main__':
    one_hot_comparator.run_server(debug=True, port=8054)
Here is the code for handling callbacks.
def parseCustomFormula(children, mode):
    if mode == 'production':
        recorded_herbs = {}
        for index, div in enumerate(children[:-2]):
            dropdown, _ = div['props']['children']
            herb_name = dropdown['props']['value']
            if herb_name != "":
                recorded_herbs[herb_name] = 1
    else:
        recorded_herbs = {herb: 1 for herb in one_hot_test_cases[int(mode)]}

    if len(recorded_herbs) == 0:
        return None

    custom_formula = {herb: 0 for herb in one_hot_model.columns}
    custom_formula.update(recorded_herbs)
    custom_formula['Name'] = f'custom_formula'
    custom_formula['Location'] = "不適用"
    custom_formula = pd.DataFrame(custom_formula, index=[0])
    return custom_formula


@callback(
    Output('one_hot_compartor_heatmap', 'figure'),
    Input('one_hot_pairwise_distances_store', 'data'),
    Input('one_hot_selected_formulae_indices', 'data'),
    Input('one-hot-herb-count', 'children'),
    State('one-hot-mode', 'value'),
    prevent_initial_call=True
)
def draw_heatmap(data, indices_to_names, herb_count, mode):
    if mode == 'production' and int(herb_count) == 0:
        return one_hot_default_heatmap

    if data is None:
        return no_update

    table_pairwise_distances = pd.read_json(StringIO(data))  # note that the last row is the custom formula
    indices_to_names = json.loads(indices_to_names)

    selected_formulae_names = list(indices_to_names.values())
    selected_formulae_indices = list(map(int, indices_to_names.keys()))

    # note that heatmap is a square matrix
    table_pairwise_distances = table_pairwise_distances.iloc[selected_formulae_indices, selected_formulae_indices]

    heatmap = get_heatmap(
        table_pairwise_distances,
        labels=selected_formulae_names,
        precomputed=True
    )
    return heatmap


@callback(
    Output('one_hot_composition_by_type', 'figure'),
    Input('one_hot_table', 'data'),
)
def draw_composition_by_type(data):
    if len(data) == 0:
        return no_update

    return get_formulae_composition_by_type(
        data,
        title="Composition of formulae by herb categories",
        one_hot=True
    )


def getNewHerbItem(indexNum):
    return {
        'props': {
            'id': {
                'type': 'custom-herb-container',
                'index': indexNum
            },
            'children': [
                {
                    'props': {
                        'options': one_hot_model_herbs,
                        'value': '',
                        'id': {
                            'type': 'custom-herb-name',
                            'index': indexNum
                        },
                        'search_value': '',
                        'placeholder': 'Select herb',
                        'style': {'width': '12rem'}
                    },
                    'type': 'Dropdown',
                    'namespace': 'dash_core_components'
                },
                {
                    'props': {
                        'children': 'Delete',
                        'id': {
                            'type': 'custom-herb-delete',
                            'index': indexNum
                        },
                        'n_clicks': 0,
                        'style': {'width': '8rem'}
                    },
                    'type': 'Button',
                    'namespace': 'dash_html_components'
                }
            ],
            'style': {'display': 'flex', 'justifyContent': 'flex-start', 'gap': '2rem'}
        },
        'type': 'Div', 'namespace': 'dash_html_components'
    }


@callback(
    Output('one-hot-dynamic-fields-container', 'children', allow_duplicate=True),
    Output('one-hot-herb-count', 'children'),
    Input('add-field-button', 'n_clicks'),
    Input({"type": "custom-herb-delete", "index": ALL}, 'n_clicks'),
    State('one-hot-dynamic-fields-container', 'children'),
    prevent_initial_call=True
)
def edit_fields(add_click, delete_clicks, children):
    triggered = ctx.triggered[0]['prop_id'].split('.')
    isAdd = True if triggered == ['add-field-button', 'n_clicks'] else False

    patch_children = Patch()
    if isAdd:
        if add_click == 0:
            return no_update, no_update
        new_field = getNewHerbItem(len(children) - 2)
        patch_children.insert(-2, new_field)
        herb_count = len(children) - 2 + 1
    else:
        items_to_remove = []
        for index, n_click in enumerate(delete_clicks):
            if n_click > 0:
                items_to_remove.append(index)
        if len(items_to_remove) == 0:
            return no_update, no_update

        for index in items_to_remove:
            del patch_children[index]
        herb_count = len(children) - 2 - 1

    return patch_children, str(herb_count)


@callback(
    Output('one_hot_table', 'data', allow_duplicate=True),
    Output('one_hot_table', 'style_data_conditional', allow_duplicate=True),
    Output('one_hot_comparator_textTable', 'data'),
    Output('one_hot_comparator_textTable', 'style_data_conditional'),
    Output('one_hot_pairwise_distances_store', 'data'),
    Output('one_hot_selected_formulae_indices', 'data'),
    Input('one-hot-herb-count', 'children'),
    Input('one_hot_submit_button', 'n_clicks'),
    Input('one-hot-k', 'value'),
    Input('one-hot-mode', 'value'),
    State('one-hot-dynamic-fields-container', 'children'),
    prevent_initial_call=True
)
def submit_fields(herb_count, n_clicks, k, mode, children):
    herb_count = int(herb_count)
    if mode == 'production':
        if herb_count == 0:
            return [], [], [], [], no_update, no_update  # clear all

        if n_clicks == 0:
            return no_update, no_update, no_update, no_update, no_update, no_update

    if k is None:
        return no_update, no_update, no_update, no_update, no_update, no_update

    custom_formula = parseCustomFormula(children, mode)
    if custom_formula is None:
        return no_update, no_update, no_update, no_update, no_update, no_update

    one_hot_table = pd.concat([one_hot_model, custom_formula], ignore_index=True)
    table_pairwise_distances = pairwise.pairwise_distances(
        removeTextColumn(one_hot_table),
        metric='cosine'
    )
    neigh = NearestNeighbors(n_neighbors=k + 1, metric='precomputed')
    neigh.fit(table_pairwise_distances)
    # each element of indices is the neighbors' indices for the corresponding sample in the parameter
    distances, indices = neigh.kneighbors([table_pairwise_distances[-1]])
    distances, indices = distances.tolist()[0], indices.tolist()[0]

    names = one_hot_table.iloc[indices]["Name"].tolist()
    selected_locations = one_hot_table.iloc[indices]["Location"].tolist()
    indices_to_name = dict(zip(indices, names))
    one_hot_table = one_hot_table.iloc[indices]
    one_hot_table = one_hot_table.loc[:, (one_hot_table != 0).any(axis=0)]

    one_hot_table_styles = [
        {
            'if': {
                'column_id': column,
                'filter_query': '{{{}}} != 0'.format(column)
            },
            'backgroundColor': '#98FF98',

        } for column in one_hot_table.columns[2:]
    ]
    one_hot_table = one_hot_table.to_dict('records')

    # note that chinese_quantity_model has different length as quantity_model
    # they have different integer indices
    text_df = chinese_quantity_model.copy()
    names.remove('custom_formula')
    text_table = text_df.set_index('Name').reindex(names).reset_index()
    text_table = text_table.loc[:, (text_table != '無').any(axis=0)]
    text_table.insert(1, "Location", selected_locations[1:])
    textTable_styles = [
        {
            'if': {
                'column_id': column,
                'filter_query': '{{{}}} != 無'.format(column)
            },
            'backgroundColor': '#98FF98',

        } for column in text_table.columns[2:]
    ]
    text_table = text_table.to_dict('records')

    return (
        one_hot_table,
        one_hot_table_styles,
        text_table,
        textTable_styles,
        json.dumps(table_pairwise_distances.tolist()),
        json.dumps(indices_to_name)
    )
Case Study for Quantity Formula Origin Finder
Since 金花清感顆粒 did not disclose the detailed dosages for each herb, we chose a medical case2 (Figure 6) in 2022 for the Quantity Formula Origin Finder. A COVID-19 patient was treated with a custom formula prescribed by a traditional Chinese Medicine practitioner. Traditional Chinese Medicine students may only see the herbs included but have little idea which formulae from Shang-Han-Lun may look similar to this in terms of their herb species and quantities. To have an extended learning from Shang-Han-Lun. we can use the formula origin finder.
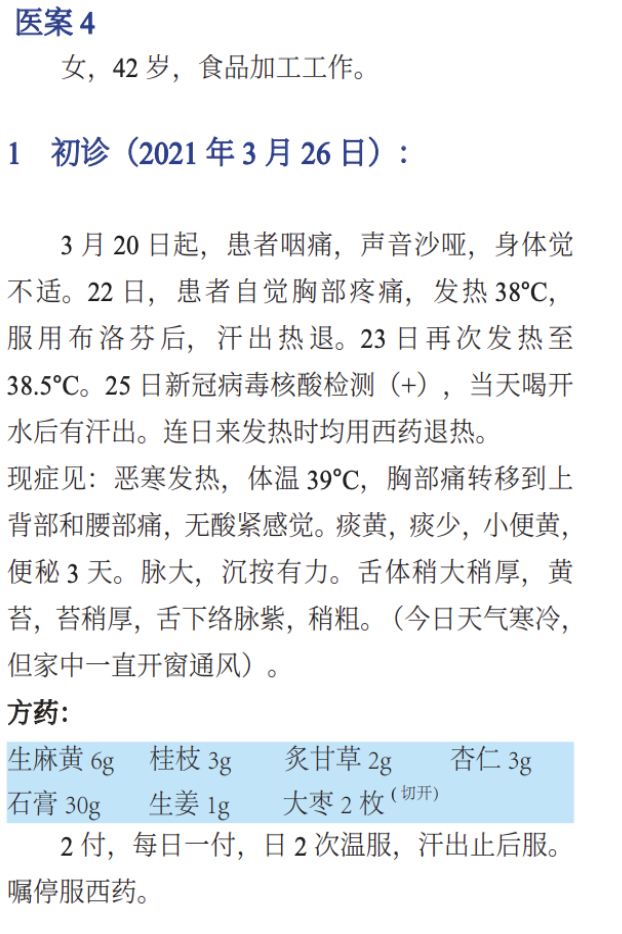
We can input the herbs and dosages in this custom formula to the Quantity Origin Finder.

Full Interface

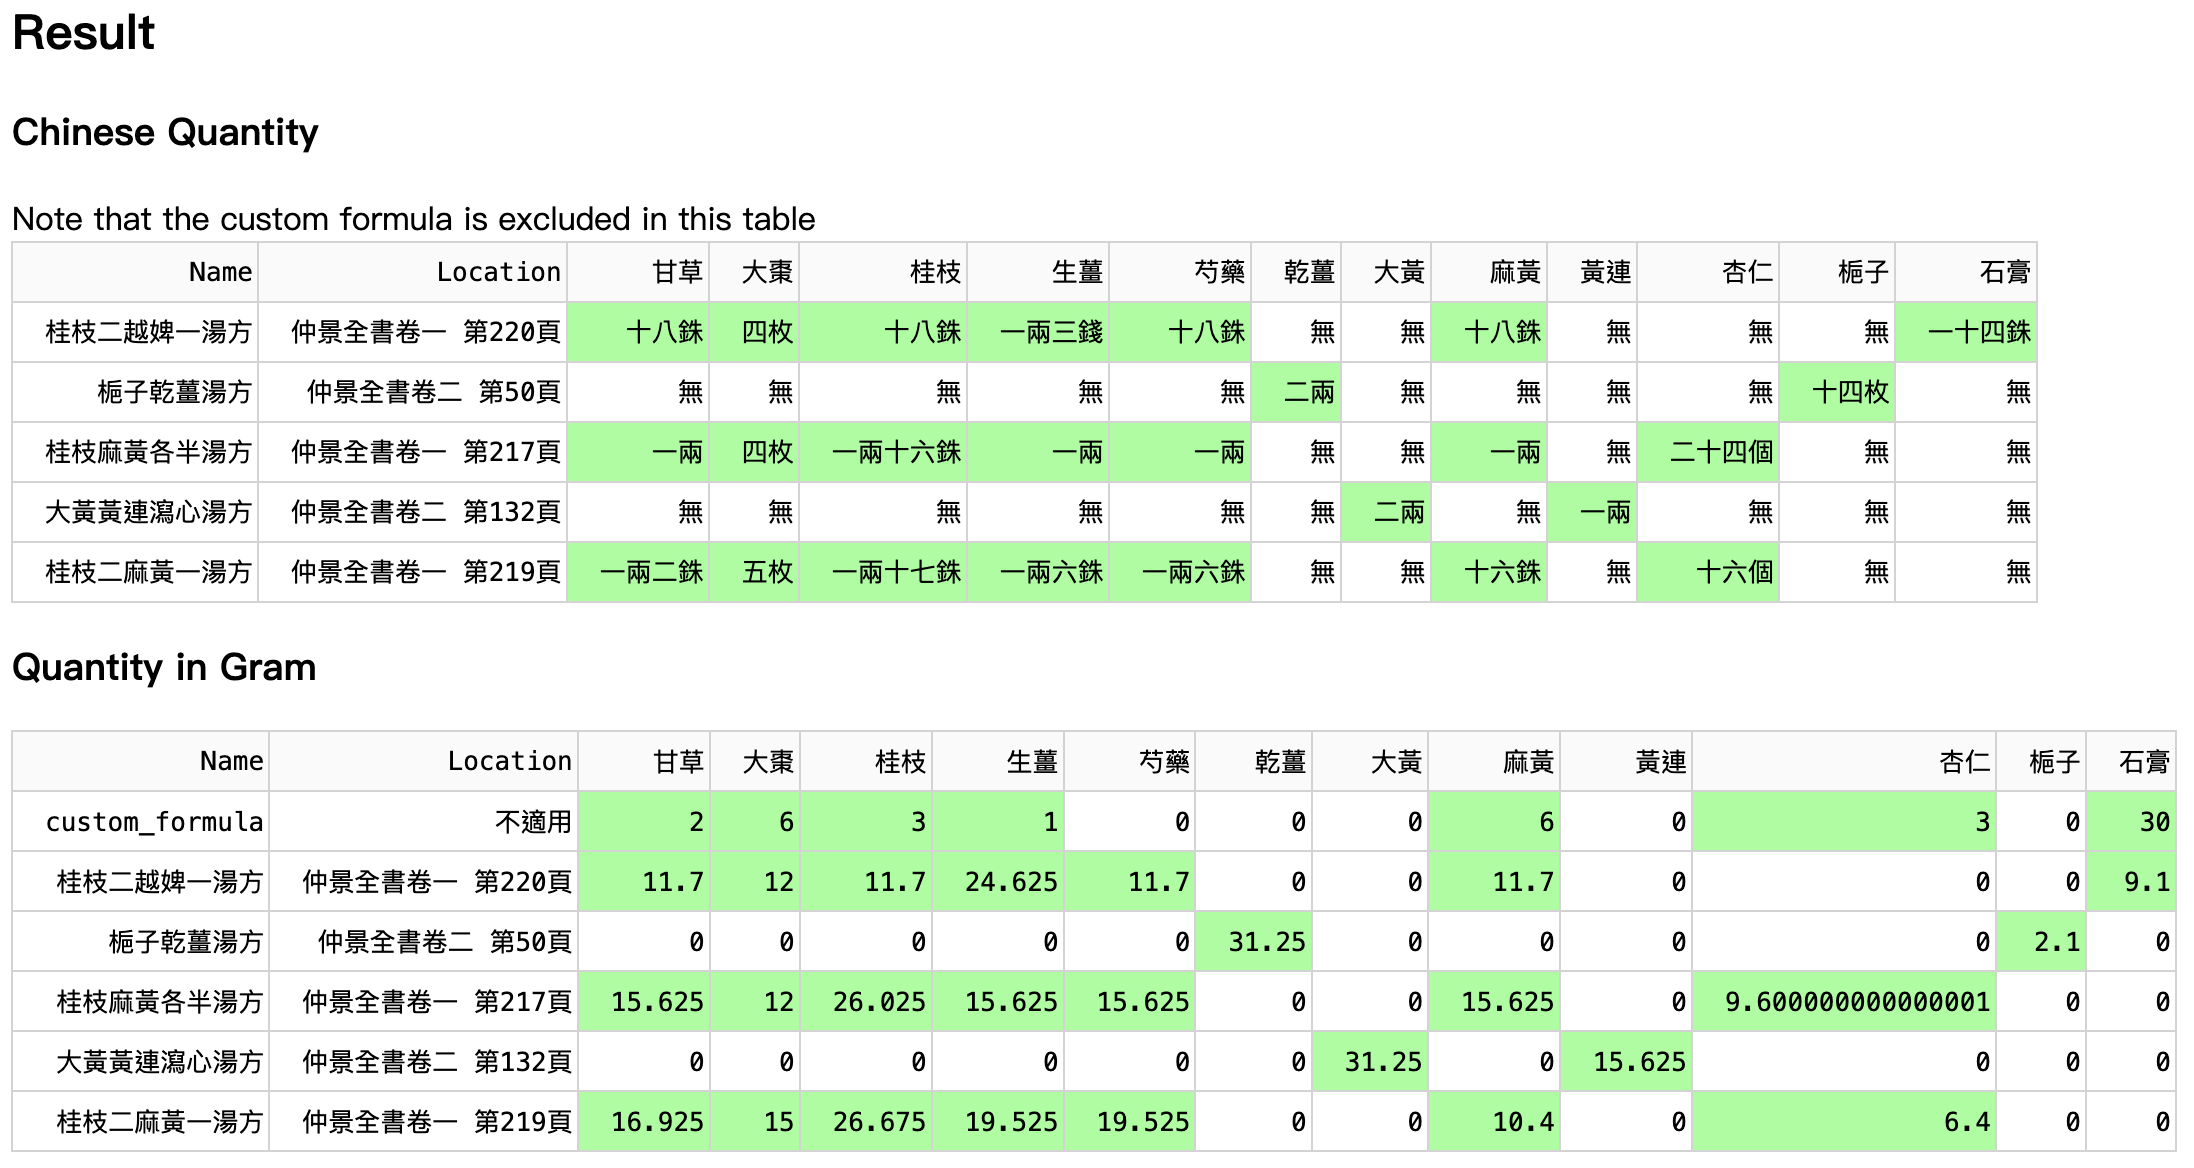




The table (Figure 8) shows Gui-Zhi-Er-Yue-Pi-Yi-Tang-Fang (桂枝二越婢一湯方) is the closest to the custom formula. Then, the TCM student could further compare and study, for a more thorough analysis.
Zhi-Zi-Gan-Jiang-Tang-Fang (梔子乾薑湯方) and Da-Huang-Huang-Lian-Xie-Xin-Tang-Fang (大黃黃連瀉心湯方) seem to be inconsistent with other neighbours since they share no herbs with the custom formula. However, they do share many zeroes with the custom formula.
We hypothesize that the KNN algorithms may prioritize the common zeroes over the non-empty features. Also, the second reason may be the “curse of dimensionality”. There are 89 herbs, corresponding to the 89 dimensions in the dataset. But we only have 112 samples. Therefore, some outliers may be the k-neighbors of many samples. It is the inherent property of a high-dimensional vector space (Radovanovic et al., 2009)3. We believe that increasing the sample size will alleviate the problem.

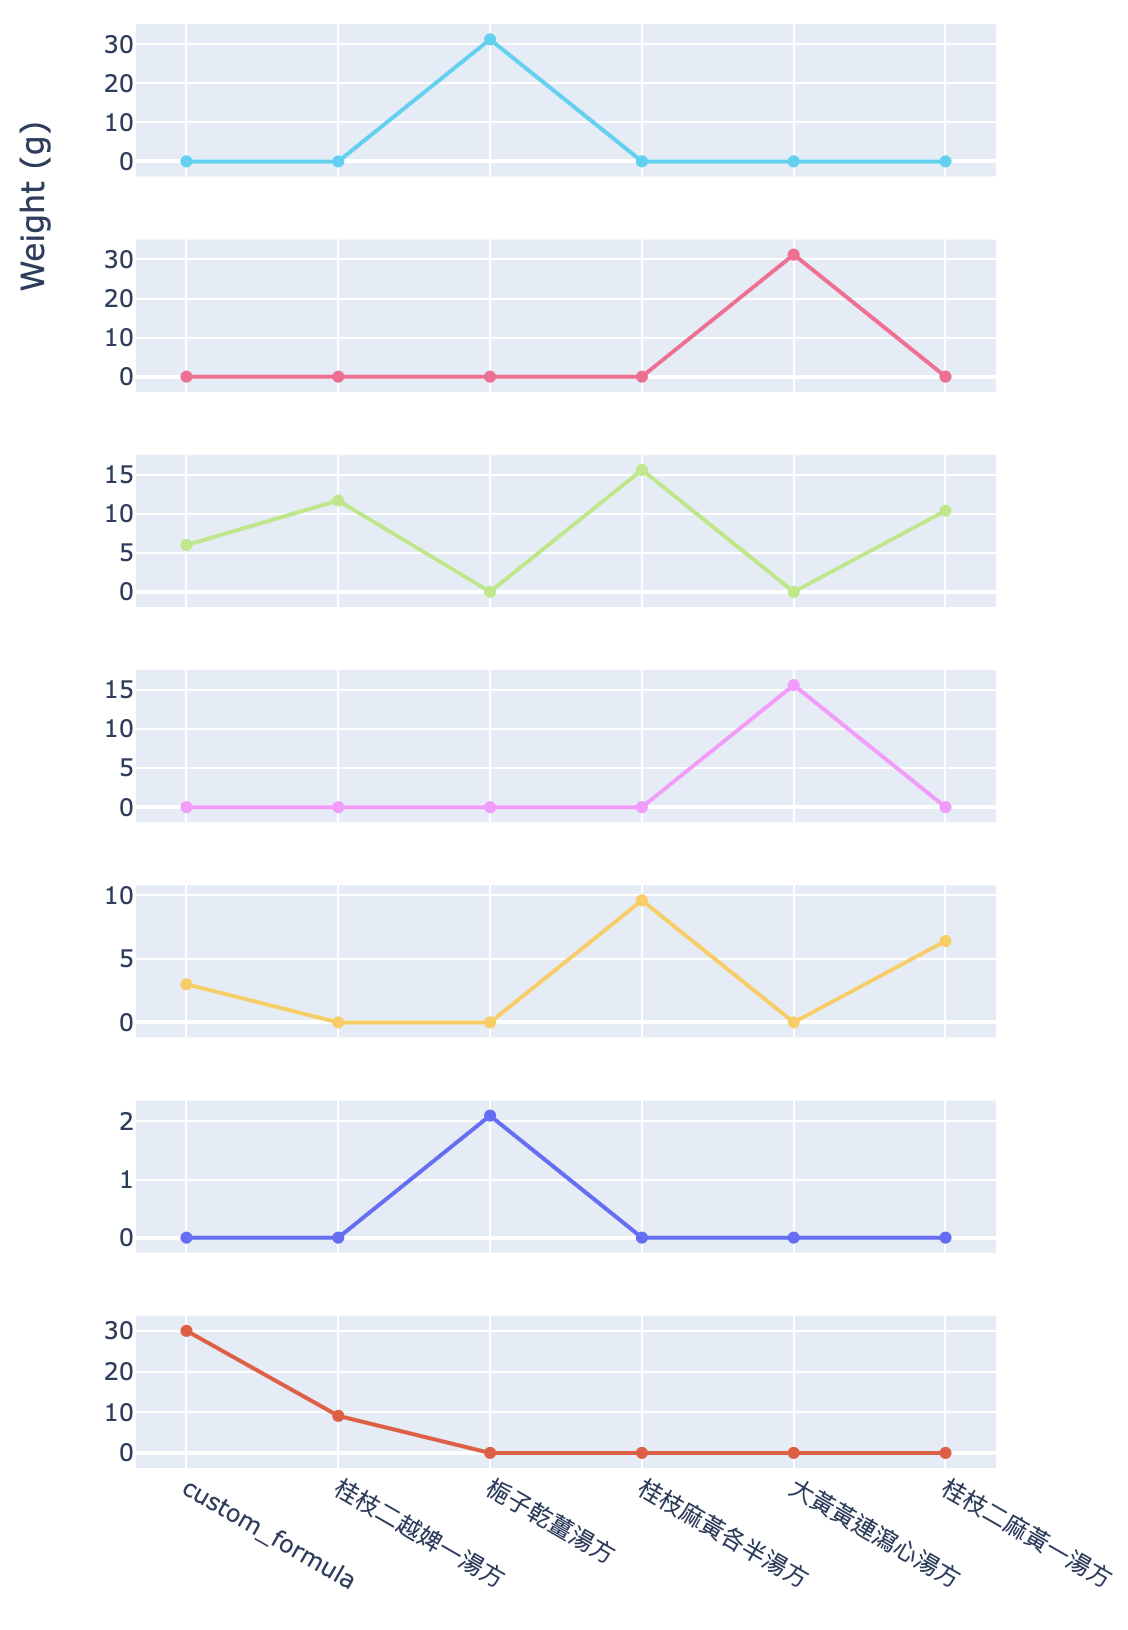
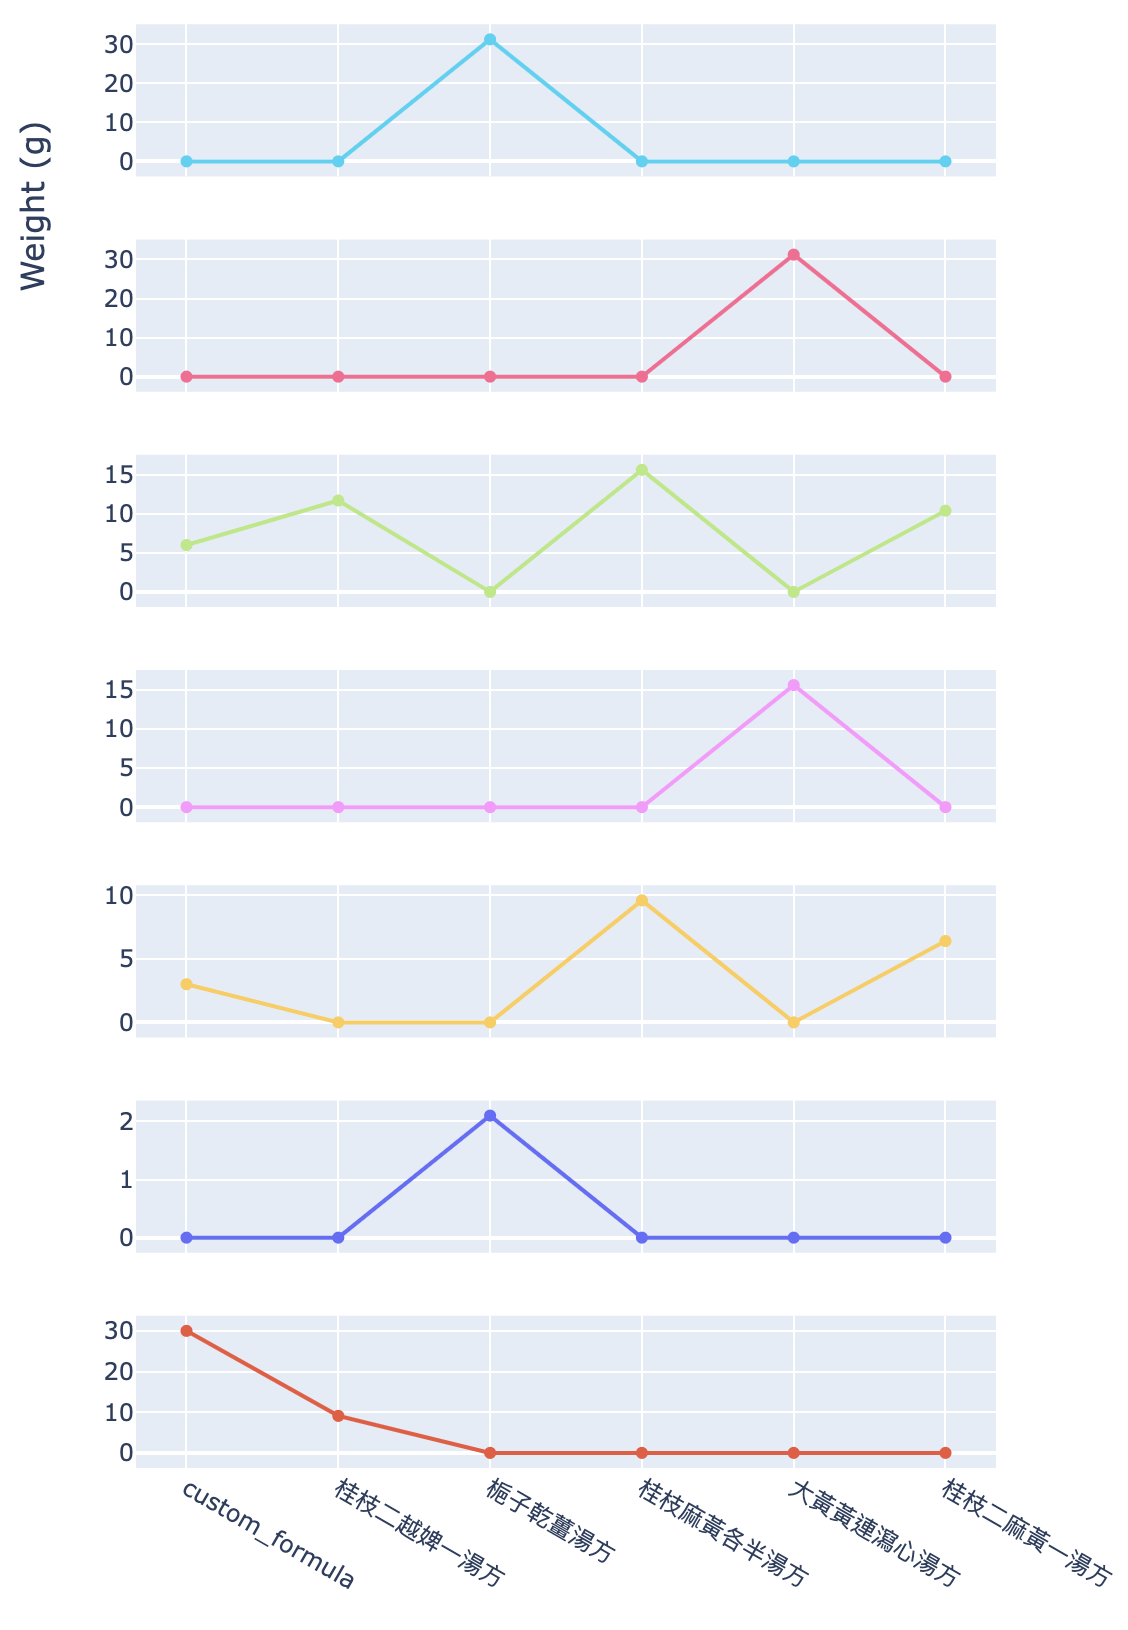
Apart from the heatmap and herb types comparison, we have also visualised the dosage trend and compositions. Figure 9 shows the overview of all dosage trends.

Figure 10 shows the dosage trend for each herb mentioned in the origin finder result.

The last graph (Figure 11) compares the composition of formulae by dosage.

Full Code for Quantity Formula Origin Finder
Here is the code for imports and data loading.
import pandas as pd
import plotly.express as px
import plotly.subplots
from sklearn.preprocessing import StandardScaler, MinMaxScaler
from sklearn.metrics import pairwise
from sklearn.neighbors import NearestNeighbors
import plotly.graph_objects as go
from dash import Dash, dcc, html, Input, Output, callback, dash_table, State, Patch, no_update, ALL, ctx
from io import StringIO
import json

from utils import get_formulae_composition_by_type, getLocation, removeTextColumn

pd.DataFrame.iteritems = pd.DataFrame.items  # since iteritems is removed from pandas 2.0

quantity_model = pd.read_excel("../clean_quantity_model.xlsx", header=0)
herbs = list(quantity_model.columns[1:])
chinese_quantity_model = pd.read_excel("../chinese_quantity_model.xlsx", header=0)
herb_types = pd.read_excel("../herbs_name_animalplantseparation.xlsx", header=0, index_col=0, usecols=[1, 3])
formulae_locations = getLocation()
quantity_model = pd.merge(quantity_model, formulae_locations, how='left', on='Name')

# relocate the location columns
locations = quantity_model.pop('Location')
quantity_model.insert(1, locations.name, locations)
Here are the functions for drawing figures.
# add custom_formula to df and scale the result df
def scale_df(df, custom_formula, df_scaler, preserve_name=False):
    numeric_table = pd.concat([df, custom_formula], ignore_index=True)  # None df will be dropped silently

    if "Name" in numeric_table.columns:
        names = numeric_table.loc[:, "Name"]
        numeric_table = removeTextColumn(numeric_table)
    else:
        names = None
        preserve_name = False

    scaled_numeric_table = df_scaler.fit_transform(numeric_table)
    scaled_numeric_table = pd.DataFrame(scaled_numeric_table, columns=herbs)
    if preserve_name:
        scaled_numeric_table.insert(0, 'Name', names)

    return scaled_numeric_table


def get_heatmap(df, labels, precomputed=False):
    if not precomputed:
        df = scale_df(df, None, MinMaxScaler())
        dist = pairwise.euclidean_distances(df)
        df = pd.DataFrame(dist, index=labels, columns=labels)

    title = "Differences across formulae"
    description = "<br><sup>The Darker, The More Similar</sup>"
    fig = px.imshow(
        df,
        labels=dict(x="Formula 1", y="Formula 2", color="Distances"),
        x=labels,
        y=labels,
        title=title+description
    )
    if len(df.index) > 24:
        fig.update_layout(height=800)
    else:
        fig.update_layout(autosize=True)
    return fig


def get_parallel_plot(numeric_table, overviewTitle, subplotTitle):
    numeric_table = numeric_table.loc[:, (numeric_table != 0).any(axis=0)]
    cols = list(numeric_table.columns)
    for col in ['Name', 'Location']:
        if col in cols:
            cols.remove(col)

    plots = plotly.subplots.make_subplots(
        rows=len(cols),
        cols=1,
        shared_xaxes=True,
        y_title="Weight (g)",
    )
    overview = go.Figure(layout={'title': overviewTitle})

    for index, col in enumerate(cols):
        fig = go.Scatter(
            x=numeric_table.loc[:, 'Name'],
            y=numeric_table.loc[:, col],
            mode='lines+markers+text',
            name=f'{col}'
        )
        plots.add_trace(
            fig,
            row=1 + index,
            col=1,
        )
        overview.add_trace(fig)

    plots.update_layout(
        height=len(cols) * 120,
        width=600,
        title_text=subplotTitle
    )
    return overview, plots


def get_formulae_composition_by_dosage(data, title):
    numeric_table = pd.DataFrame(data)
    numeric_table = numeric_table.loc[:, (numeric_table != 0).any(axis=0)]
    names = list(numeric_table.loc[:, "Name"])
    numeric_table = removeTextColumn(numeric_table)
    totals = numeric_table.sum(axis=1)
    cols = list(numeric_table.columns)

    fig = go.Figure(layout={
        "xaxis": {"title": "Formulae name"},
        "yaxis": {"title": "Percentage"},
        "title": title
    })
    for col in cols:
        dosages = numeric_table.loc[:, col]
        percentages = [dosage / total * 100 for dosage, total in zip(dosages, totals)]
        fig.add_trace(
            go.Bar(
                x=names,
                y=percentages,
                name=col,
            )
        )
    fig.update_layout(barmode='stack')
    return fig

scaled_quantity_default_heatmap = get_heatmap(
    removeTextColumn(quantity_model),
    labels=quantity_model.loc[:, 'Name'],
)
default_overview, default_stack_trend = get_parallel_plot(
    quantity_model.loc[:3, :],
    overviewTitle='Sample overview of dosage trends',
    subplotTitle="Sample stacked subplots with dosage trends"
)
default_formulae_composition_by_dosage = get_formulae_composition_by_dosage(
    quantity_model.loc[:3, :],
    title="Composition of sample formulae by dosage"
)
default_formulae_composition_by_type = get_formulae_composition_by_type(
    quantity_model.loc[:3, :],
    title="Sample formulae composition by herb types"
)
Here is the code for the layout.
test_cases = [
    {
        '麻黃': 6,
        '桂枝': 3,
        '甘草': 2,
        '杏仁': 3,
        '石膏': 30,
        '生薑': 1,
        '大棗': 6
    },
    {
            '桂枝': 20,
            '甘草': 15,
            '麻黃': 3,
            '杏仁': 5,
            '生薑': 5,
    },
    {
            '桂枝': 31.625,
            '甘草': 2,
            '麻黃': 46.875,
            '杏仁': 125,
            '生薑': 25,
    }
]

quantity_comparator = Dash(__name__)

quantity_comparator.layout = html.Div([
    html.H1("Quantity Formula Origin Finder"),
    html.Div("Aim: To find the k-th nearest formulae to the custom formula"),
    html.Label("Choose k form 1 to 24: ", htmlFor='k'),
    dcc.Input(
        id='k',
        value=5,
        min='1',
        max='24',
        type='number',
    ),

    html.H2("Mode", id="setting-mode", style={"display": "none"}),
    dcc.RadioItems(
        id='mode',
        options=[
            {"label": "production", "value": "production"},
            {"label": f"test case 1 {test_cases[0]}", "value": "0"},
            {"label": f"test case 2 {test_cases[1]}", "value": "1"},
        ],
        value='production',
        style={"display": "none"}
    ),
    html.H2("Scaling", id="setting-scaling", style={"display": "none"}),
    dcc.RadioItems(
        id='standardize',
        options=[
            {"label": "No scaling", "value": "no_scaling"},
            {"label": "Standardize", "value": "standardize"},
            {"label": "Normalize", "value": "normalize"}
        ],
        value="normalize",
        style={"display": "none"}
    ),

    html.H2("Setting"),
    html.Div("Please input the custom formula"),
    html.Label("Number of herb(s) inputted: ", htmlFor='herb-count'),
    html.P("0", id='herb-count', style={"display": 'inline-block'}),
    html.Div(
        id='dynamic-fields-container',
        children=[
            html.Button(
                'Add Herb',
                id='add-field-button',
                n_clicks=0,
                style={'marginTop': "5px", "height": "25px", "display": "block"}
            ),
            html.Button(
                'Submit / Update the Formula',
                id='submit-button',
                n_clicks=0,
                style={'marginTop': "10px", "height": "30px", "display": "block"}
            ),
        ]
    ),

    html.H2("Result"),
    html.H3("Chinese Quantity"),
    html.Div("Note that the custom formula is excluded in this table", id='table-scope-hint'),
    dash_table.DataTable(
        data=[],
        id='quantity_compartor_textTable',
        style_table={
            'width': 'fit-content',
        },
        style_cell={
            'paddingLeft': '1rem',
        },
    ),

    html.H3("Quantity in Gram"),
    dash_table.DataTable(
        data=[],
        id='quantity_compartor_numericTable',
        style_table={
            'width': 'fit-content',
        },
        style_cell={
            'paddingLeft': '1rem',
        },
    ),

    html.H3("Heatmap"),
    html.Div(
        "Note that when there are too many formulae to show, the formula name may be hidden at the axis. You can zoom "
        "in for more details."
    ),
    dcc.Graph(
        figure=scaled_quantity_default_heatmap,
        id='quantity_compartor_heatmap'
    ),

    dcc.Graph(
        figure=default_overview,
        id='overview_trend'
    ),
    dcc.Graph(
        figure=default_stack_trend,
        id='dosage_trends'
    ),

    html.H3("Composition of formulae"),
    dcc.Graph(
        figure=default_formulae_composition_by_dosage,
        id='composition_by_dosage'
    ),
    dcc.Graph(
        figure=default_formulae_composition_by_type,
        id='composition_by_type'
    ),

    # standardized(quantity_model + custom_formula), col[0] = Name
    dcc.Store(id='quantity_custom_store'),
    # k-th neighbors of the custom formula: dict of {index: Name}, len = k + 1, include the custom formula
    dcc.Store(id='selected_formulae_indices')
])


quantity_comparator.title = 'Quantity Encoded Formula Origin Finder'


if __name__ == '__main__':
    quantity_comparator.run_server(debug=True, port=8053)
Here is the code for handling callbacks.
def parseCustomFormula(children, mode):
    if mode == 'production':
        submitted_data = {}
        for index, div in enumerate(children[:-2]):
            dropdown, quantity, _ = div['props']['children']
            herb_name = dropdown['props']['value']
            herb_quantity = quantity['props']['value']
            if herb_name != "" and herb_quantity != '' and herb_quantity > 0:
                submitted_data[f'{herb_name}'] = herb_quantity
    else:
        submitted_data = test_cases[int(mode)]

    if len(submitted_data) == 0:
        return None

    custom_formula = {herb: 0 for herb in quantity_model.columns}
    custom_formula.update(submitted_data)
    custom_formula['Name'] = f'custom_formula'
    custom_formula['Location'] = "不適用"
    custom_formula = pd.DataFrame(custom_formula, index=[0])

    return custom_formula


@callback(
    Output('quantity_compartor_heatmap', 'figure'),
    Input('quantity_custom_store', 'data'),
    Input('selected_formulae_indices', 'data'),
    Input('herb-count', 'children'),
    State('mode', 'value'),
    prevent_initial_call=True
)
def draw_heatmap(data, indices_to_names, herb_count, mode):
    if mode == 'production' and int(herb_count) == 0:
        return scaled_quantity_default_heatmap

    if data is None:
        return no_update

    table_pairwise_distances = pd.read_json(StringIO(data))  # note that the last row is the custom formula
    indices_to_names = json.loads(indices_to_names)

    selected_formulae_names = list(indices_to_names.values())
    selected_formulae_indices = list(map(int, indices_to_names.keys()))

    # note that heatmap is a square matrix
    table_pairwise_distances = table_pairwise_distances.iloc[selected_formulae_indices, selected_formulae_indices]

    heatmap = get_heatmap(
        table_pairwise_distances,
        labels=selected_formulae_names,
        precomputed=True
    )
    return heatmap


@callback(
    Output('composition_by_dosage', 'figure'),
    Input('quantity_compartor_numericTable', 'data'),
)
def draw_composition_by_dosage(data):
    if len(data) == 0:
        return no_update

    return get_formulae_composition_by_dosage(
        data,
        title="Composition of formulae by dosage"
    )


@callback(
    Output('composition_by_type', 'figure'),
    Input('quantity_compartor_numericTable', 'data'),
)
def draw_composition_by_type(data):
    if len(data) == 0:
        return no_update

    return get_formulae_composition_by_type(
        data,
        title="Composition of formulae by herb types"
    )


@callback(
    Output('overview_trend', 'figure'),
    Output('dosage_trends', 'figure'),
    Input('quantity_compartor_numericTable', 'data'),
)
def draw_parallel_plot(data):
    if len(data) == 0:
        return default_overview, default_stack_trend

    numeric_table = pd.DataFrame(data)
    return get_parallel_plot(
        numeric_table,
        overviewTitle='Overview of all dosage trends',
        subplotTitle="Stacked subplots on dosage trends"
    )


def getNewHerbItem(indexNum):
    return {
        'props': {
            'id': {
                'type': 'custom-herb-container',
                'index': indexNum
            },
            'children': [
                {
                    'props': {
                        'options': herbs,
                        'value': '',
                        'id': {
                            'type': 'custom-herb-name',
                            'index': indexNum
                        },
                        'search_value': '',
                        'placeholder': 'Select herb',
                        'style': {'width': '12rem'}
                    },
                    'type': 'Dropdown',
                    'namespace': 'dash_core_components'
                },
                {
                    'props': {
                        'value': '',
                        'type': 'number',
                        'id': {
                            'type': 'custom-herb-quantity',
                            'index': indexNum
                        },
                        'placeholder': 'Quantity(gram)',
                        'n_blur': 0,
                        'n_blur_timestamp': -1,
                        'style': {'width': '15rem'}
                    },
                    'type': 'Input',
                    'namespace': 'dash_core_components'
                },
                {
                    'props': {
                        'children': 'Delete',
                        'id': {
                            'type': 'custom-herb-delete',
                            'index': indexNum
                        },
                        'n_clicks': 0,
                        'style': {'width': '8rem'}
                    },
                    'type': 'Button',
                    'namespace': 'dash_html_components'
                }
            ],
            'style': {'display': 'flex', 'justifyContent': 'flex-start', 'gap': '2rem'}
        },
        'type': 'Div', 'namespace': 'dash_html_components'
    }


@callback(
    Output('dynamic-fields-container', 'children', allow_duplicate=True),
    Output('herb-count', 'children'),
    Input('add-field-button', 'n_clicks'),
    Input({"type": "custom-herb-delete", "index": ALL}, 'n_clicks'),
    State('dynamic-fields-container', 'children'),
    prevent_initial_call=True
)
def edit_fields(add_click, delete_clicks, children):
    triggered = ctx.triggered[0]['prop_id'].split('.')
    isAdd = True if triggered == ['add-field-button', 'n_clicks'] else False

    patch_children = Patch()
    if isAdd:
        if add_click == 0:
            return no_update, no_update
        new_field = getNewHerbItem(len(children) - 2)
        patch_children.insert(-2, new_field)
        herb_count = len(children) - 2 + 1
    else:
        items_to_remove = []
        for index, n_click in enumerate(delete_clicks):
            if n_click > 0:
                items_to_remove.append(index)
        if len(items_to_remove) == 0:
            return no_update, no_update

        for index in items_to_remove:
            del patch_children[index]
        herb_count = len(children) - 2 - 1

    return patch_children, str(herb_count)


@callback(
    Output('quantity_compartor_numericTable', 'data', allow_duplicate=True),
    Output('quantity_compartor_numericTable', 'style_data_conditional', allow_duplicate=True),
    Output('quantity_compartor_textTable', 'data'),
    Output('quantity_compartor_textTable', 'style_data_conditional'),
    Output('quantity_custom_store', 'data'),
    Output('selected_formulae_indices', 'data'),
    Input('herb-count', 'children'),
    Input('submit-button', 'n_clicks'),
    Input('k', 'value'),
    Input('mode', 'value'),
    Input('standardize', 'value'),
    State('dynamic-fields-container', 'children'),
    prevent_initial_call=True
)
def submit_fields(herb_count, n_clicks, k, mode, toStandardize, children):
    herb_count = int(herb_count)
    if mode == 'production':
        if herb_count == 0:
            return [], [], [], [], no_update, no_update  # clear all

        if n_clicks == 0:
            return no_update, no_update, no_update, no_update, no_update, no_update

    if k is None:
        return no_update, no_update, no_update, no_update, no_update, no_update

    custom_formula = parseCustomFormula(children, mode)
    if custom_formula is None:
        return no_update, no_update, no_update, no_update, no_update, no_update

    # do not pass scaled quantity model here
    # otherwise, the scaled quantity model will be standardised again
    # note that name column is dropped here
    if toStandardize == "standardize":
        scaled_numeric_table = scale_df(quantity_model, custom_formula, StandardScaler())
    elif toStandardize == 'normalize':
        scaled_numeric_table = scale_df(quantity_model, custom_formula, MinMaxScaler())
    else:
        scaled_numeric_table = pd.concat([quantity_model, custom_formula], ignore_index=True)

    scaled_numeric_table = removeTextColumn(scaled_numeric_table)
    table_pairwise_distances = pairwise.pairwise_distances(scaled_numeric_table, metric='l2')
    neigh = NearestNeighbors(n_neighbors=k + 1, metric='precomputed')
    neigh.fit(table_pairwise_distances)
    # each element of indices is the neighbors' indices for the corresponding sample in the parameter
    distances, indices = neigh.kneighbors([table_pairwise_distances[-1]])
    distances, indices = distances.tolist()[0], indices.tolist()[0]

    numeric_table = pd.concat([quantity_model, custom_formula], ignore_index=True)

    # indices.insert(0, len(numeric_table.index) - 1)
    names = numeric_table.iloc[indices]["Name"].tolist()
    selected_locations = numeric_table.iloc[indices]["Location"].tolist()
    indices_to_name = dict(zip(indices, names))
    numeric_table = numeric_table.iloc[indices]
    numeric_table = numeric_table.loc[:, (numeric_table != 0).any(axis=0)]

    numericTable_styles = [
        {
            'if': {
                'column_id': column,
                'filter_query': '{{{}}} != 0'.format(column)
            },
            'backgroundColor': '#98FF98',

        } for column in numeric_table.columns[2:]  # do not highlight name and location columns
    ]
    numeric_table = numeric_table.to_dict('records')

    # note that chinese_quantity_model has different length as quantity_model
    # they have different integer indices
    text_df = chinese_quantity_model.copy()
    names.remove('custom_formula')
    text_table = text_df.set_index('Name').reindex(names).reset_index()
    text_table = text_table.loc[:, (text_table != '無').any(axis=0)]
    text_table.insert(1, "Location", selected_locations[1:])
    textTable_styles = [
        {
            'if': {
                'column_id': column,
                'filter_query': '{{{}}} != 無'.format(column)
            },
            'backgroundColor': '#98FF98',

        } for column in text_table.columns[2:]
    ]
    text_table = text_table.to_dict('records')

    return (
        numeric_table,
        numericTable_styles,
        text_table,
        textTable_styles,
        json.dumps(table_pairwise_distances.tolist()),
        json.dumps(indices_to_name)
    )
Obstacle
The main challenge lies in seamlessly integrating data analysis into a Dash web app. Whenever the user modifies the formula, the entire application must be rerun and accurately compute the corresponding figures and tables. This requires a careful design of the callback structures (Figure 12). The integration takes 2 weeks to complete, almost equivalent to the time required for developing the data analysis component of the origin finder.

Limitation
Both types of formula origin finders can only accept herbs recorded in Shang-Han-Lun, which are only 89 herbs. However, there are thousands of common herbs in the Chinese Medicine industry.
Moreover, Shang-Han-Lun is about treating cold. Therefore, our finders may not be capable of finding the origins of custom formulae which treat other diseases.
Another limitation is that our model does not fully capture the features of a formula. For example, the properties of herbs used, the preparation method of herbs and the precautions of formulae are not considered in the model.
Fortunately, it is possible to scale up our finders by recording more formulae and herbs in our model. This may require a large-scale OCR without manual proofreading, or utilizing the digitalized versions of the classics. Under different typesetting, our formulae separation and modelling algorithm need to be more general. Large Language Models would be a good candidate.
Also, future work can involve integrating the uncaptured features into the model. For example, using a numerical scale to represent the properties of herbs.
References:
- 內地援港中藥「金花清感顆粒」、「連花清瘟膠囊」先派竹篙灣, 香港01, https://www.hk01.com/article/740069?utm_source=01articlecopy&utm_medium=referral ↩︎
- Xiao-Fen H. , Sai-Mei L. (2022, April). Clinical Cases: Chinese Medicine Treatment of Five COVID-19 Patients. Chinese Quintessence Research. doi: 10.53388/CCMR2022014 ↩︎
- Radovanovic, Milos & Nanopoulos, Alexandros & Ivanovic, Mirjana. (2009). Nearest neighbors in high-dimensional data: The emergence and influence of hubs. Proceedings of the 26th International Conference On Machine Learning, ICML 2009. 382. 109. 10.1145/1553374.1553485. ↩︎


