HIST4702 (2022-23) Digital History Project: SARS in Asia
Map: Comparing SARS Transmission in Hong Kong and Singapore
Hong Kong and Singapore Outbreak Map

Description
The left map indicates the situation of the outbreak of SARS in Singapore in 2003. As shown in the map, there were mainly six hospitals that received SARS patients, namely the Changi General Hospital, KK Women’s and Children’s Hospital, Singapore General Hospital, Tan Tock Seng Hospital, Alexandra Hospital, and National University Hospital.
There were three superclusters in Singapore, all of them concentrated within the hospitals. Tan Tock Seng Hospital experienced the biggest supercluster, with 109 cases in total. The second biggest supercluster was in the Singapore General Hospital, with a total number of 60 cases. The last supercluster was in National University Hospital, with 8 infected cases.[1]
This map can show two key spatial elements of the outbreak of SARS in Singapore. Firstly, all the superclusters were concentrated in hospitals. Hospitals are the highest-risk places for spreading infectious diseases like SARS. Secondly, the superclusters were all found in the Central Region (the Southern part of Singapore). The Central Region is the most crowded region of the country. This can be shown by the fact that the Central Region has the densest road system in Singapore. This implies that there is a higher chance of disease outbreaks in more dense and crowded places.
The right map displays the holistic situation of the outbreak of SARS in Hong Kong from late February to late May 2003. As indicated by different symbols, it shows the location of the 18 hospitals in Hong Kong, superclusters like the Amoy Garden (212 cases), the Prince of Wales Hospital (321 cases), and the Metropole Hotel (16 cases), as well as the location of the public estates, whereas the orange lines represent the major roads in Hong Kong.[2]
With the aid of this map, we could understand the spatial elements of the SARS outbreak in Hong Kong. Firstly, Hong Kong is a city with a high density of residential buildings and roads, which could explain why it is prone to infectious diseases. Although the map only shows the locations of the public housing estates, it is already visible how crowded and clustered they were. This proves that people were living so near to each other with very few open spaces between each building. It is sensible that in the real situation with private housing as well, the areas would be even more crowded, which led to the outbreak of superclusters. Secondly, the complexity and high connectivity of major roads in Hong Kong could be the reason why the disease could spread so quickly and extensively. It spread to other parts of Hong Kong despite the fact that superclusters only concentrated in places with a high density of buildings. Overall, this map is useful to understanding the situation and inducing the reasons behind the outbreak.
Arguments
Another important observation we could get is by comparing the maps of Singapore and Hong Kong. We chose these two places to compare because of their similar level of development yet significantly different geography. Singapore and Hong Kong are two financial centres in Asia, with relatively high population density and complex road networks. However, as we could see from the Singapore map, Singapore is slightly less dense than Hong Kong and there are comparatively more open spaces. In contrast, the roads in Hong Kong, especially those in the urban areas occupied by crowded residential buildings, are so close to each other that we could not distinguish the separate routes of roads on the map clearly. Furthermore, the superclusters in Singapore only occured in hospitals instead of hotels or residential buildings. Therefore, we could logically conclude that superclusters usually happen in hospitals, and the higher the population density and connectivity of road networks, the easier and faster the spread of the disease. Also, it is possible that the Singapore government reacted more effectively to the outbreak of superclusters compared to the Hong Kong government, so the disease mainly only happened within the hospitals. It was reported that most cases in Singapore were primary transmissions instead of secondary ones, whereas it was the opposite in Hong Kong.[3] All in all, the maps are very useful for doing comparisons that enable us to understand the factors behind the spread of pandemics.
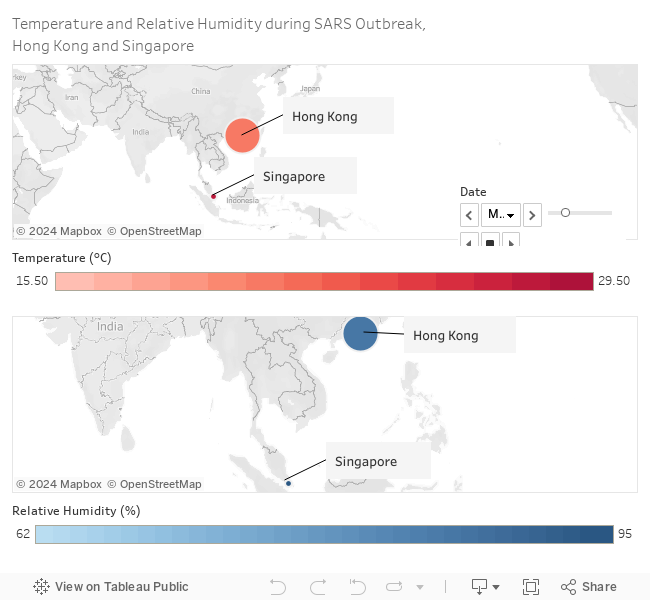
Temperature and Relative Humidity during SARS Outbreak, 25 February to 23 June, 2003, Hong Kong and Singapore[4]
Description
This series of two maps shows the temperature (above, in red) and relative humidity (below, in blue) in Hong Kong and Singapore (respective locations in the maps represented by a dot and annotated) during the main wave of SARS outbreak in spring and summer of 2003. In Hong Kong, the wave of outbreak began on 17 March, 2003 and ended on 23 June, 2003, lasting 99 days (both days inclusive) with a total of 1755 recorded cases. In Singapore, the wave began on 25 February, 2003 and ended on 5 May, 2003, lasting 70 days (both days inclusive) with a total of 238 recorded cases.
Reading the maps
The darkness of the red or blue colours increases with the temperature or humidity. The shade of red increases by one degree with each degree celsius (℃) of temperature (from 15.5℃ to 29.5℃); the shade of blue increases by one degree with each percent (%) of relative humidity (from 62% to 95%). The sizes of the dots (representing Hong Kong and Singapore) correspond to the number of cases recorded on each day in each city; on days with no cases recorded in a city, the dot is in a minimal size.
The Tooltip includes the following details: 1) place name (Hong Kong or Singapore); 2) date and day n of outbreak; 3) Temperature or relative humidity, shown numerically; and 4) number of cases on each day, shown numerically.
Rationale
K. H. Chan et al. (2011) demonstrated that SARS CoV remains stable and infectious for an extended period of time (a few days) in most conditions of temperature and relative humidity. The viability of the virus significantly decreases only when the temperature and relative humidity are high (e.g. 38℃ and 95% RH).[5] Nonetheless, Chan’s team, experimenting with multiple sets of temperature and humidity levels, seems to indicate a trend, that an increase in temperature and RH is disadvantageous for viral viability. The temperature and RH levels recorded in this study do not correspond to the rather extreme, experimental conditions that scientists can create in the laboratory. Therefore, this study attempts to evaluate the applicability of Chan’s findings, as well as a popular theory that high air temperatures lower the infective ability of viruses, with a set of actual, historical, non-laboratory-conditioned data, recorded in two places with somewhat different climate conditions. Temperature and relative humidity at 12nn each day are adopted as the data in this series of maps.
Arguments
Singapore, being a tropical country, experiences a relatively stable temperature and humidity throughout the year. The temperature in the scope of this study fluctuates between 26 and 29 degrees, while the RH has a much larger range (around 60-95%). For Hong Kong, the temperature range is much larger (15.5-29.5 degrees), while the RH range is similar to that of Singapore. Yet, the two places saw two trajectories of outbreak, one significantly different from the other in terms of the number of recorded cases.
Either with or without taking into account the possible delays between temperature and humidity levels and the number of cases (a few days), it appears that during the high points of the outbreaks (mid-March to early-April), there were days with temperature and humidity levels that were relatively low (or not much higher than the days before) but saw many cases recorded. Meanwhile, there were also days with high temperature and humidity but few to no cases reported. In different periods of time, similar temperature and humidity levels could result in different patterns of reported cases. Therefore, there does not appear to have existed a clear positive/negative correlation (let alone causation) between temperature and humidity levels and the number of cases reported within the scope of this study. The findings indicate the complexity of viral transmission and viability, which requires taking into account more factors for a convincing explanation.
[1] Singapore Ministry of Health, “Special Feature: Severe Acute Respiratory Syndrome (SARS),” Communicable Diseases Surveillance in Singapore (2003): ix.
[2] World Health Organization Department of Communicable Disease, Surveillance and Response, “Consensus document on the epidemiology of severe acute respiratory syndrome (SARS),” WHO/CDS/CSRlGARI2003.11 (2003): 21-23.
[3] World Health Organization Department of Communicable Disease, Surveillance and Response, “Consensus document on the epidemiology of severe acute respiratory syndrome (SARS),” 21-22, 23-24.
[4] The data used to create the maps come from the following source. Hong Kong temperature: “天文台日平均氣溫(攝氏度) 二零零三,” Hong Kong Observatory, accessed November 10, 2022, https://www.weather.gov.hk/tc/cis/dailyElement.htm?ele=TEMP&y=2003. Hong Kong relative humidity: “天文台日平均相對濕度(百分比) 二零零三,” Hong Kong Observatory, accessed November 10, 2022, https://www.weather.gov.hk/tc/cis/dailyElement.htm?ele=RH&y=2003. Singapore temperature: “Historical Daily Records,” Meteorological Service Singapore, accessed November 17, 2022, http://www.weather.gov.sg/climate-historical-daily/. Singapore relative humidity: “Singapore, Singapore Weather History,” Weather Underground, accessed November 17, 2022, https://www.wunderground.com/history/daily/sg/WSSS/date/2003.
[5] K.H. Chan et al., “The Effects of Temperature and Relative Humidity on the Viability of the SARS Coronavirus”, Advances of Virology (2011): 2-3. https://doi.org/10.1155/2011/734690.
Website Designed by:
Website Group of HIST4702 Digital History (2022-23)