HIST4702 (2022-23) Digital History Project: SARS in Asia
Map: International Transmission of SARS
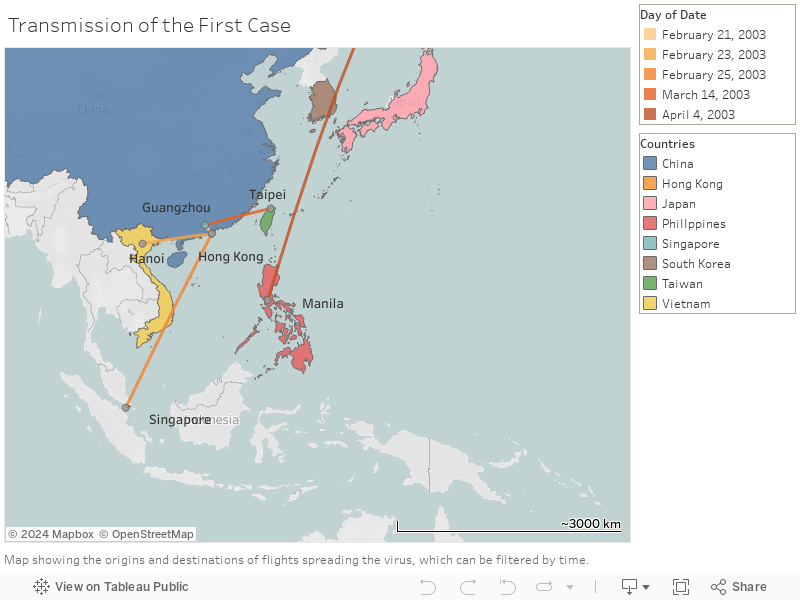
Transmission Route of First Cases in Several Asian Countries
Description
This map displays the outbreak of the first case in different Asian countries, namely Hong Kong, Taiwan, Singapore, the Philippines, and Vietnam. The earliest case in Asia (Professor LJL) happened in Hong Kong on the 21st of February 2003. According to a news report, Professor Liu was a 64-year-old physician from the No.2 Affiliated Hospital of Zhongshan Medical University, the very first place of the SARS outbreak in the world. He developed flu-like symptoms on 15th February, having been infected in the hospital where he worked. To attend a wedding, he arrived in Hong Kong with the SARS virus from Guangzhou by bus on the 21st of February, and stayed in room 911 of the Metropole Hotel. At least 16 other guests were infected during his stay in the hotel, leading to the first supercluster case in Hong Kong.[1]
The next first infected case happened in Vietnam. The disease was brought by a Vietnamese businessman, who arrived in Hanoi on 23 February after traveling to China and Hong Kong. He was finally admitted to the Hanoi-French Hospital on 26th of February.[2] On the other hand, Singapore recorded its first case on 25th February, Ms. EM who has been unwell since returning from a shopping trip to Hong Kong on that day. She stayed in room 938 at the Metropole Hotel on 21st February and therefore got infected. She was finally admitted to the Tan Tock Seng Hospital on 1st March, leading to the first supercluster there. On 14th March, there was the spread of SARS in Taiwan. The wife of a 54-year-old man who was in Guangdong in late February was admitted with respiratory symptoms. Lastly, the first case was recorded in the Philippines on 4th April. A 46-year-old Filipino nurse working in Toronto arrived in Manila on that day.[3] Yet, it is important to note that the first case of Canada was transmitted from Hong Kong.
Arguments
One more useful piece of information shown in this map is the air network accessibility from China in March 2003 of different countries. According to the scientific research on the international diffusions of SARS in 2006, these accessibility scores were calculated based in part on that employed by the International Air Transport Association in deriving the global airport connectivity monitor. This methodology takes into consideration the number of scheduled flights among cities (both on non‐stop flights and via connections at intermediate hubs).[4] From this data, we could see that the accessibility score does not have a positive relationship with the number of cases. This could be exemplified by the case of Japan, where there were no reported cases of SARS. It was a bizarre and interesting phenomenon given the high air network accessibility from China to Japan (620.75). Our group has tried to look for some relevant academic research investigating the reason why Japan was barely infected. Yet, we could not find anything particularly useful. Therefore, we think further research could focus on that so that we could know the reasons behind successful prevention of infections. Also, there were three recorded cases in South Korea, which were all imported from elsewhere. However, we could not find any news articles or information regarding the details of the first infected case.
All in all, this map shows that most first cases were not imported from China, the origin of SARS, but from Hong Kong. This could be explained by the high accessibility of Hong Kong and its high connectedness with other parts of the world as an international city. One special trait of Hong Kong is that it is not only connected with other countries but also China as we could see that the first case in Hong Kong was imported from Guangzhou and the patient arrived by bus. That was why Hong Kong was the main transmission point of the disease to other countries, both in Asia and even other continents like North America and Europe.
Air Transmission Routes in Asia
Description
The second map shows seven international flights that have been associated with the transmission of SARS from symptomatic probable cases to passengers and/or crew. A 72-year-old man who had visited the Prince of Wales Hospital in Hong Kong took Air China Flight 112 (CA112) on 15/03/2003 to travel from Hong Kong to Beijing. He infected 20 passengers and 2 flight crews on CA112.[5] Two passengers who were infected with SARS on CA112, then took the flight Thai Airways International 614 (TG614) on 23/03/2003 from Beijing and Bangkok, and spread the disease to Thailand.[6]
Singapore Airline 25 (SQ25) contained a Singaporean physician, who attended an academic conference in Frankfurt and took SQ25 on 14-15/03/2003 back to Singapore. He was treated in the Tan Tock Seng Hospital and is believed to be one of the origins of the Tan Tock Seng Hospital supercluster.[7]
Cathay Pacific 510 (CX510) carried four passengers from Taiwan who developed symptoms of SARS during their stay in Beijing. They later traveled to Hong Kong and took flight CX510 on 21/03/2003 to fly back to Taiwan. This flight alone contributed 4 import cases to Taiwan.[8]
A 30-year-old man who had traveled on Thai Airways flight Thai Airways International 606 (TG606) on 29/03/2003 from Bangkok was infected with SARS.[9]
Cathay Pacific 402 (CX402) carried a 40-year-old man who infected SRAS in Hong Kong, and took CX402 on 30/03/2003 to Taiwan.[10]
Cathay Pacific 714 (CX714) on 15/04/2003 contained a flight attendant who was infected by SARS. This flight was from Singapore to Hong Kong.[11]
Arguments
The above flights are the most important flights that are responsible for the international transmission of SARS through air transport. This map shows that air transmission is certainly one of the most important ways of international transmission. Taking CA112 as example, apart from spreading SARS from Hong Kong to Beijing, it is also responsible for the spread to Thailand, as two CA112 passengers later traveled to Thailand, and spread SARS there. This shows that in a highly globalized world, in which people will usually travel on not only one, but multiple flights, diseases like SARS can easily be spread globally through international flights. Due to the connectedness of different international flights, the disease can spread from one country to another.
Also, as mentioned in the Singapore map, Tan Tock Seng Hospital is the biggest supercluster in Singapore. One of the origins of the outbreak in Tan Tock Seng Hospital is the passenger on SQ25. This again shows that international flight is a very important way to spread the disease. SQ25 is not only responsible for the infected passenger on that flight, but may potentially be responsible for the 109 infected cases in Tan Tock Seng Hospital. In short, international flights can be responsible for a super spread of one country. These two examples show that international flight is an important factor that affects the global disease-spreading situation.
However, although international flight is an important factor that helped spread SARS to different countries, it is surprising that there are only a few flights that are responsible for the spread of SARS. Unlike other pandemics like COVID-19, in which numerous international flights helped spread the pandemic, there are only seven flights that helped spread SARS from one country to another. We speculate that this is due to the quick responses of different countries by flight restriction to prevent cases from importing from other countries. Also, the connectedness of countries may also be relatively lower in 2003 as compared to now. This may also explain the relatively little international flights that are responsible for the spread of SARS and other pandemic like COVID-19.
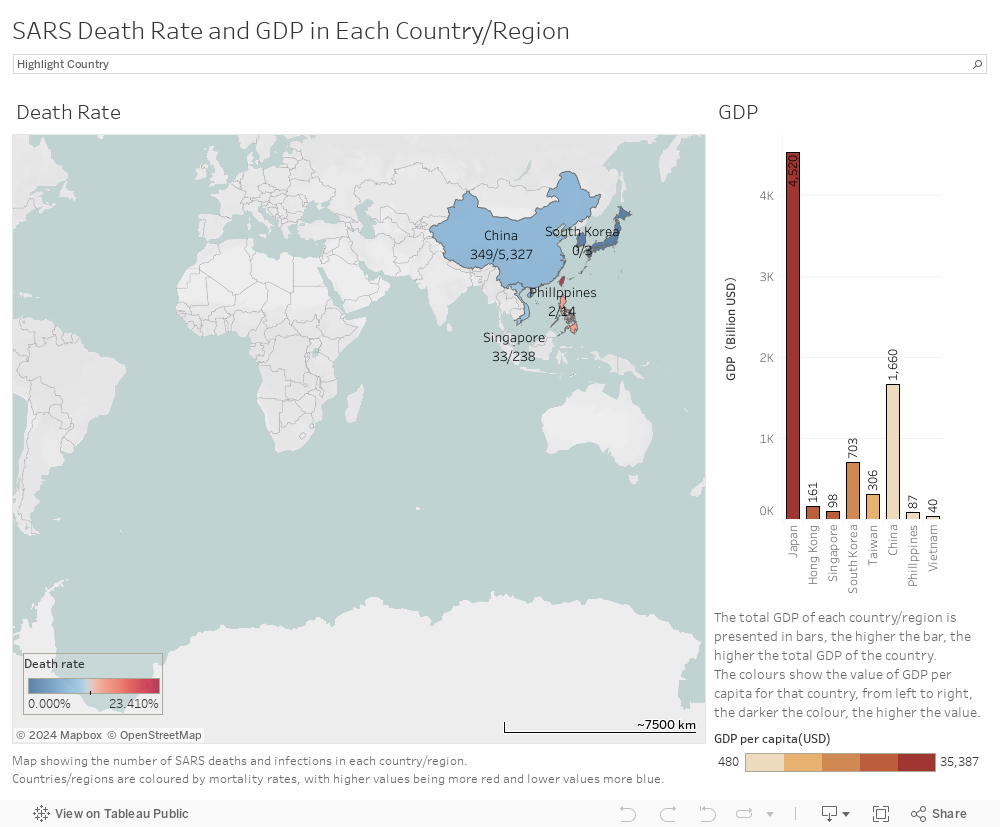
Death Rate and GDP in Each Country/Region
Description
The map on the left hand side shows the death rates of SARS in China, Vietnam, Singapore, South Korea, Japan and the Philippines. The colour tends to be more red when the death rate is higher. When we click on a particular country, a box containing information on the death rate will pop out. On the right hand side, the total GDP of each country/region is presented in bars; the higher the bar, the higher the total GDP of the country. The colours show the value of GDP per capita for that country, from left to right; the darker the colour, the higher the value. Comparing both data side by side, we can analyze the relationship between death rates and economic levels of different countries.
Arguments
This map proves that there is no positive or negative correlation between the nations’ death rates and their GDP or GDP per capita. As we can see from the map, Taiwan has the highest death rate while China has the lowest one (South Korea and Japan are not taken into account in this case because the number of cases is too small). Yet, the GDP per capita of China is lower than that of Taiwan.
[1] World Health Organization, SARS: How a Global Epidemic was Stopped (Geneva: World Health Organization, Western Pacific Region, 2006), 8.
[2] World Health Organization, SARS: How a Global Epidemic was Stopped, 8.
[3] World Health Organization. “Weekly epidemiological record= Relevé épidémiologique hebdomadaire.”, 1940.
[4] Bowen, John T, and Christian Laroe. “Airline networks and the international diffusion of severe acute respiratory syndrome (SARS).” The Geographical Journal vol. 172,2 (2006): 130-144. https://doi.org/10.1111/j.1475-4959.2006.00196.x.
[5] World Health Organization, SARS: How a Global Epidemic was Stopped, 16, 22.
[6] World Health Organization, SARS: How a Global Epidemic was Stopped, 27.
[7] World Health Organization, SARS: How a Global Epidemic was Stopped, 15.
[8] World Health Organization Department of Communicable Disease, Surveillance and Response, “Consensus document on the epidemiology of severe acute respiratory syndrome (SARS),” 17.
[9] World Health Organization Department of Communicable Disease, Surveillance and Response, “Consensus document on the epidemiology of severe acute respiratory syndrome (SARS),” 17.
[10] World Health Organization Department of Communicable Disease, Surveillance and Response, “Consensus document on the epidemiology of severe acute respiratory syndrome (SARS),” 17.
[11] World Health Organization Department of Communicable Disease, Surveillance and Response, “Consensus document on the epidemiology of severe acute respiratory syndrome (SARS),” 17.
Website Designed by:
Website Group of HIST4702 Digital History (2022-23)